Download
1 / 76
760 likes | 911 Views
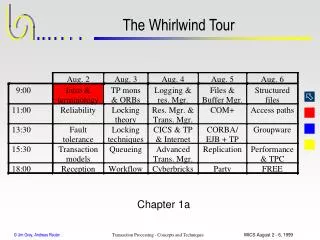
Statistical Measurement to Inform Program Decision-making: A Whirlwind Tour. Presenters: Michael Crow Training For: Region 5 Autobody Project Team Chicago November 10, 2010. Acknowledgements.

E N D
Statistical Measurement to Inform Program Decision-making:A Whirlwind Tour Presenters: Michael Crow Training For: Region 5 Autobody Project Team Chicago November 10, 2010
Acknowledgements • This presentation is a very compressed version of a course funded by EPA’s Office of Strategic Environmental Management, Evaluation Support Division (also supporting this presentation) • Collaborator in designing course: Tracy Dyke Redmond, Industrial Economics
Overview • Basic Questions • Why measure, why statistics, why do a project like this • Case Study • Explores how an initiative like this works, what the statistical jargon means, and what can be said about the results • What It Means for You • Key things to think about moving forward • Goal: familiarize you with key concepts for implementing a statistical measurement project like yours
Why Measure Performance? • Performance measurement and evaluation allow you to test the theory or logic of how your program is to achieve desired outcomes Resources/ Inputs Activities Outputs Outcomes Customers Short-term Intermediate Long-term
Why Use Statistics? So how does statistics support performance measurement and evaluation? Statistics can help you: • Measure and describe the outcomes of your program. • Perhaps help determine the extent to which your program contributed to or caused observed outcomes, and predict or estimate program impacts.
What Do We Mean by “Statistics”? • When we say “statistics” in this course, it is shorthand for a particular method of: • Collecting data using random samples from a relatively large group of entities in whose performance you are interested, and • Analyzing the data using “inferential” statistical techniques
Why Emphasize “Quality”? • Analyses will support anticipated decision-making • Experimental design and data collected will be sufficiently robust to support analyses • Data will sufficiently represent actual conditions • You will have sufficient confidence in your measures of project results/outcomes, avoiding nasty surprises and staying within budget Remember: Garbage In, Garbage Out
What Does This Mean in Practice? • Let’s find out: This course uses a case-study approach to illustrate challenges and benefits of a high-quality effort to measure program performance using statistical approaches • Performance measures • Data collection options (representativeness) • How statistics can help you collect and analyze your data • Implications of a before-and-after measurement approach, like yours
Program Example: Massasota • Hypothetical state, Massasota, is conducting an integrated enforcement and outreach initiative with 1,000 auto body shops in its state • Initiative goal: encourage shops to reduce worker exposure to hazardous chemicals and prevent pollution • Strategy includes: • Targeted inspections/enforcement • Communications announcing enforcement actions and assistance available • State offers workshops, responds to phone inquiries, and conducts on-site visits to provide assistance • Question: What and how to measure?
Key Questions for Massasota • Did the behavior of auto body shops change after implementation of the strategy? • Did Massasota reach its goal of 90% of shops in the sector achieving compliance with requirements? • Is the Massasota strategy causing observed outcomes?
Key Issue: Who Does the Measure Describe? • The group being measured should be consistent with decision-making needs: • Is the group of interest entities directly reached by your program or all entities that you want to influence? • Is the group of interest a certain class of entities (e.g., the largest or the riskiest)? • For example: Massasota wants to know if the performance of all auto body shops in the state has changed over time
What Does Massasota Decide to Measure? • Massasota is keen on boosting waterborne paint usage and develops measures related to this topic across the logic model: • Customers reached: Percentage of ALL shops receiving compliance assistance, enforcement inspections, etc. • Awareness: Percentage of ALL shops understanding the opportunity to use waterborne paints • Behaviors: Percentage of ALL shops using waterborne paints • Conditions: Estimated sector-wide emissions reductions associated with paint usage
What Does Massasota Decide to Measure? Resources/ Inputs Activities Outputs Customers Outcomes Long-Term (Strategic Aim/Impact) Intermediate Short-Term • Changes in • knowledge/attitudes • Example: • % of shops that have heard of new or existing requirements, or particular pollution prevention opportunities • Changes in • behaviors/practices • Examples: • % of facilities that are using waterborne paints • Changes in waste generation/chemical usage • Changes in • environmental • condition • Example: • Modeled changes in air emissions using data on facility practices and coating/chemical usage
Massasota: Identifying Data Sources • Massasota needs data sources for its key measure of behavior change: percentage of all shops using waterborne paints • To start, it needs baseline data on performance before the initiative is in full swing • Two readily available sources identified: • Five years of agency inspection records for targeted inspections (from about 10% of all shops) • Recent results from a trade association survey of all auto body shops in the state
Critical Quality Issue: Considering Representativeness of Data Sources • One key data quality consideration is “representativeness”: do data represent actual conditions within the full population of interest? • For example, the Massasota data set would not be representative if: • Shops from whom data is collected tend to be different than other shops in the state that are not measured • Respondents provide answers that are consistently inaccurate in a particular direction
Discussion:Representativeness of Massasota Data • Do Massasota’s existing data sources meet the requirements for representativeness?
Massasota: Considering Other Data Collection Options • Decides not to use targeted inspection or trade association data • Concerned that neither data source meets both criteria for representativeness • Considers other data collection options for feasibility and representativeness • Voluntary certification: may not provide accurate information and may not represent all facilities • On-site visits at all facilities: likely to be representative, but deemed infeasible because of expense • On-site visits only at a subset of facilities: feasible, but will it be representative?
Massasota Chooses Representative Sampling • Massasota decides to conduct random on-site visits for measurement • Selecting a random sample can mitigate concerns about representativeness • The sample must be large enough • Lack of representativeness is still possible, but the level of uncertainty can be calculated and characterized using statistical analysis • Now we’ll illustrate the idea of representative sampling with an exercise
Data Collection Using Random SamplingA Hands-On Exercise Presenter Name and Affiliation Presented at: Location Date
Module Objectives • Begin to explore data collection using statistical approaches (like what Massasota will do) • Practice drawing simple random samples and recording the results • Get a better sense of the link between random sampling and representativeness • Differentiate between descriptive and inferential statistics • Begin depicting the uncertainty associated with observed results from your samples
The “Beans” Exercise: Basics • Everybody will get one bag containing 100 beans • Each bag has exactly the same proportion of black beans and red beans as every other bag • I.e., each bag has black beans representing X% of the 100 beans in the bag and red beans representing Y% • The exact percentage is still a secret • Why are all the bags the same? • To pretend that we have taken multiple random samples from a single bag • This goes much more quickly than passing one bag around the room • Ultimate Goal:try to guess what percentage of beans are black • The Catch: you are not allowed to look inside the bag • Instead, you will try to guess what’s in your bag based on random samples • We’ll record the results and explore them together
Why Use Bags of Beans? Very similar to the “real-world”: • How can you estimate the percentage of facilities behaving in a certain way when you can’t observe the behavior of the whole population? • You can use random sampling to develop an estimate.
Everyone Draw Your First Sample • Keep your bag closed and shake it up • Without looking, draw out 5 beans • Note the percentage that are black beans • Your percentage = your # of black beans times 20% • For example, if you drew 3 black beans, your proportion would be 60% black • Put the beans back in your bag
Let’s Describe Our Initial Samples • Let’s chart the sample results • This is descriptive statistics -- describing exactly what you observed in your sample • What do you notice? • Remember: pretend we’ve drawn a bunch of different samples from a single bag containing 100 beans
Examine These Sample Results More Closely • Notice the variation in what you observed for these different samples of the same population • Key take-away: You can’t be sure that your particular sample accurately describes the population • Now let’s draw a larger sample
Now, Everyone Draw a Larger Sample • Be sure the beans from your first sample are back in your bag • Keep your bag closed and shake it up • Without looking, draw out 25 beans • Note the percentage that are black beans • Your percentage = your # of black beans times 4% • E.g., 5 black beans would be 20% black; 15 black beans would be 60% • Put the beans back in your bag
Let's Try to Guess the True Percent of Black Beans in the Bag • Remember the variation we saw in the last set of samples: Such variation is normal, and means you can expect that your sample is unlikely to be exactly right • Think of your sample as helping you infer a range of percentages in which the true population percentage might possibly lie. • Now write down an amount above and below your sample result to create what you think is a reasonable “possibilities range”: E.g., • 35% +/-30 percentage points (5%-65%) • 70% +/-10 percentage points (60%-80%) • 60% +/-20 percentage points (40%-80%)
Let’s Describe Our Second Set of Samples • Let’s chart this second set of sample results, and your guesses • Again, charting exactly what you observed in your sample is called “descriptive statistics” • Charting your guesses is related more to what is called “inferential statistics” (although inferential statistics is based on empirically based calculations, rather than just guesses) • What do you notice? • Remember: pretend we’ve drawn a bunch of different samples from a single bag containing 100 beans
Let’s Explore Your Guesses • Let’s look at the biggest range: • What influenced you to make it so big? • Let’s look at the smallest range: • What influenced you to make it so small? • Look at all these ranges: • Have you changed your mind about your own range? • Why?
Comparing Your Ranges to the True Population Percentage • Now, we’ll draw a line that shows the actual proportion of black beans in all the bags. • How many of your ranges cover this line? How many don't? • Were any of your samples exactly right about the proportion?
The Link to Inferential Statistics • What you’ve just done is comparable to inferential statistics. • Inferential statistics allows you to calculate (not just guess) how sure you can be that a specific range of possibilities, based on a specific random sample, contains the right answer for the % of black beans in the bag.
The Link to Your Program • Random sampling and inferential statistics can work with the percentage of beans in a bag or the percentage of facilities behaving in a certain way • In this exercise, we wouldn’t let you look in the bag, but many of you developed pretty good guesses based on relatively small samples beans • In the real world, you usually can’t “look in the bag” either. You can only measure the behavior of some of the facilities in which you are interested. • Inferential statistical approaches can help you develop reasonable and defensible estimates of the behavior of the whole population based on looking at just those sampled facilities. • Solely relying upon descriptive and/or qualitative approaches limits what you can say about results
Our Focus Today: Using Statistics to Infer Performance of Large Populations • Methods to characterize large groups of facilities (or other actors) allow us to: • Estimate performance at a particular point in time • Assess whether performance changes over time • We will use two powerful and fairly straightforward tools: • Survey-style data collection using simple random sampling • Assessing performance by combining your observed result with a “margin of error” (a.k.a., the “confidence interval,” which is similar to the “possibilities range” idea we used in this exercise -- but derived through formal calculations)
Basic Statistics for Assessing the Current Performance of a Group Presenters: Michael Crow Training For: Region 5 Autobody Project Team Chicago November 10, 2010
Goal of Module Introduce and practice basic statistical ideas that can be used in drawing inferences about a larger population based on a single, relatively small random sample
Overview • Key concepts: Massasota case study illustrates • “Observed” proportions • Margin of error / confidence interval • Confidence level
How Will Massasota’s Sampling Work? • Identify the full population of known auto body shops • Using multiple sources of secondary data • Visit random sample of 100 facilities at baseline • Go down a randomized list until 100 achieved • Use checklist to gather data re key concerns • Provide assistance at each facility after recording data for that facility • Maximizes benefit of each visit In the next module: Massasota undertakes post-intervention random sample, for comparison
How Does Massasota Ensure Quality Data?Apply the Four C’s • Clarity: e.g., precise questions on the inspector checklists • Completeness: e.g., strive to ID all relevant facilities, visit all sampled facilities, record all data on the checklist • Consistency: e.g., interpret issues the same way amongst each other and over time (checklist questions, facility eligibility) • Communication: e.g., when the inevitable unanticipated issues arise, team members coordinate to ensure consistency, clarity and completeness
What Massasota Finds In Its Sample 50 of the 100 facilities are using waterborne paints (dark dots)
How Massasota Describes Its Findings • Massasota typically would use descriptive statistics • It could report that 50% of shops in the sample are using waterborne paints • Called “observed” proportions because the results were actually measured, not inferred • However,Massasota wants to talk about the population of shops, not just the sample • To do so, it uses inferential statistics • Representative sampling enables Massasota to infer characteristics about the whole population from a relatively small sample
What Is Inferential Statistics? Inferential Statistics: Used to draw inferences about the full population of individuals or entities (including those not directly measured) Descriptive Statistics: Used to describe the individuals or entities that were measured • Examples of questions inferential statistics can help answer: • Based on the sample of facilities we visited, what % of all such facilities is using a particular best management practice? How did the population as a whole change over time? • Did our program affect the whole population of facilities of interest? • Examples of questions that descriptive statistics can help answer: • Of the facilities we were able to visit, what % use a particular best management practice? How did this % change over time? • Did our program affect the facilities we visited? Measurement Measurement Evaluation Evaluation
How to Go from Descriptive to Inferential? • Can Massasota just say that 50% of all shops are using waterborne paints? • Massasota sampled 1/10 of the population, so such a statement would suggest that the remaining 9/10 of shops are performing exactly the same way.
How to Infer Population Performance • Observed proportion accurate only for sample (small box on previous slide) • Can’t be certain these sampled facilities are exactly representative of the whole population • Potential error is introduced with any kind of random sampling • To better understand the whole population, Massasota can calculate a margin of error • The margin of error expresses the maximum amount by which the observed proportion would be expected to differ from the actual population proportion • The margin of error is typically stated as an amount above and below the observed proportion, e.g.,, +/- 10 percentage points
Massasota Uses a Statistical Tool to Calculate the Margin of Error • Massasota • uses the • following • inputs: • Population • Sample size • Observed proportion Statistical calculator Calculated Result: Margin of error around the observed proportion
Massasota’s Margin of Error • Massasota uses statistical formulas to calculate its margin of error is +/-8 percentage points • In other words, Massasota can expect that 8 percentage points in either direction is the maximum amount by which the observed proportion of 50% is likely to differ from the actual population proportion
Massasota’s "Confidence Interval” • Massasota can make a pretty good guess of the possible population proportions by explicitly combining the observed proportion with the margin of error: • 50%, +/- 8 percentage points, or • Between 42% and 58% • This range of possibilities, created by combining the observed proportion with the margin of error, is called the confidence interval • Massasota can be fairly confident that the percentage of all its auto body shops using waterborne paints is in this range • Why can they be confident in this interval? • Massasota is fairly unlikely to have drawn a sample with a proportion of 50% if the true population performance is outside this range
Upper bound of confidence interval (observed proportion plus 8 percentage points) Illustrating Massasota’s Confidence Interval Observed proportion (50%) 70% 60% Proportion 50% Lower bound of confidence interval (observed proportion minus 8 percentage points) 40% 30%
Distinguishing Margin of Error from Confidence Interval • You’ve seen that “margin of error” and “confidence interval” are two very closely related concepts • How to remember the difference: • By itself, the margin of error tells us only how much sampling erroris likely associated with an observed proportion • By explicitly combining the margin of error with the observed proportion, we get the confidence interval. • The confidence interval tells us a precise range in which we can be confidentthat the true population proportion lies