Download
1 / 20
200 likes | 289 Views
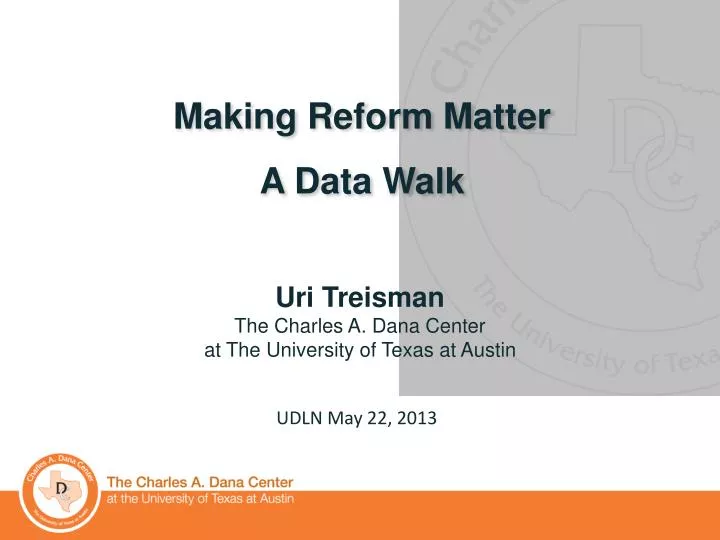
Making Reform Matter A D ata Walk. Uri Treisman The Charles A. Dana Center at The University of Texas at Austin. UDLN May 22, 2013. Higher than U.S. average Not measurably different from U.S. average Lower than U.S. average . PISA 2006 Mathematics.

E N D
Making Reform Matter A Data Walk Uri Treisman The Charles A. Dana Center at The University of Texas at Austin UDLN May 22, 2013
Higher than U.S. average Not measurably different from U.S. average Lower than U.S. average PISA 2006 Mathematics USA ranked 25th out of 30 OECD countries U.S.A. Source: NCES, PISA 2006 Results, http://nces.ed.gov/surveys/pisa/
Source: Michael Marder, 2013; from PSID, CNEF, UNICEF, PISA datasets.
Source: Michael Marder, 2013; from PSID, CNEF, UNICEF, PISA datasets.
Other Countries’ Average Scale Score MathPerformance on 8th Grade TIMSS Comparedwith the U.S. Source: Data taken from the Trends in International Mathematics and Science Study (TIMSS), accessed Jan 10, 2013 at http://nces.ed.gov/timss/index.asp. Computations of categories by the Charles A. Dana Center. 6
Mathematics Achievement at the 8th Grade (TIMSS 2011) Average scale score by country Source: Data taken from the Trends in International Mathematics and Science Study (TIMSS), accessed Jan 10, 2013 at http://nces.ed.gov/timss/index.asp. Data display by the Charles A. Dana Center. 7
Science Achievement at the 8th Grade (TIMSS 2011) Average scale score by country Source: Data taken from the Trends in International Mathematics and Science Study (TIMSS), accessed Jan 10, 2013 at http://nces.ed.gov/timss/index.asp. Data display by the Charles A. Dana Center. 8 8
Bachelor’s attainment for high-income young people is 68 pointshigher than for low-income youth. Source: “Bachelor’s Degree Attainment by Age 24 by Family Income Quartiles, 1970 to 2010.” Graphic: The Education Trust 9
NAEP Math: Grade 4 *Accommodations not permitted Source: NAEP Data Explorer, NCES (ProficientScale Score = 249) Graphic: The Education Trust
National Public – Grade 8 NAEP Math *Accommodations not permitted Source: NAEPData Explorer, NCES (Proficient Scale Score = 299)
Scale Scores by State – Low-Income Students NAEP Data Explorer, NCES (Proficient Scale Score = 299)
Scale Scores by State – Higher Income Students NAEP Data Explorer, NCES (Proficient Scale Score = 299)
8th Grade Hispanic – Proficient 10% 19% 23%
Urban Math PerformanceLatino students Note: Basic Scale Score = 243; Proficient Scale Score = 281 Chart Source: Education Trust, 2011 NAEP TUDA Results Data Source: NAEP Data Explorer, NCES
African-American students with strong math performancein the fifth grade are less likely to be placed in eighth grade algebra than are their peers Source: NCES, “Eighth-Grade Algebra: Findings from the Eighth-Grade Round of the Early Childhood Longitudinal Study, Kindergarten Class of 1998-99 (ECLS-K)” (2010), graph by Education Trust.
Math classes at high-poverty, high-minority secondary schools are more likely to be taught by out-of-field* teachers. Note: High-poverty school: 55 percent or more of the students are eligible for free/reduced-price lunch. Low-poverty school :15 percent or fewer of the students are eligible for free/reduced-price lunch. High-minority school: 78 percent or more of the students are black, Hispanic, American Indian or Alaskan Native, Asian or Pacific Islander. Low-minority school : 12 percent or fewer of the students are non-white students. *Teachers with neither certification nor major. Data for secondary-level core academic classes (math, science, social studies, English) across the U.S. Source: Education Trust Analysis of 2007-08 Schools and Staffing Survey data.
Now, instead of being the “land of opportunity,” the U.S. has one of lowest rates of intergenerational mobility. Source: Tom Hertz, “Understanding Mobility in America” (Washington, D.C.: Center for American Progress, 2006). Graph by Education Trust.


![d ata[0]](https://cdn1.slideserve.com/3300577/slide1-dt.jpg)