Download
1 / 21
220 likes | 524 Views
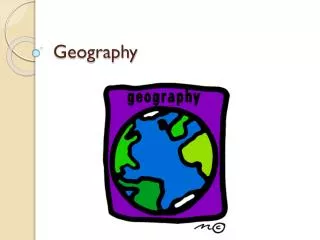
Geography. Basic Knowledge & Tools . What is Geography?. Geography - the study of the earth and everything on it, includes: People Places Regions Cultures Technology Environments As we try to learn about these categories we will need to use some tools. What do we use to study Geography?.

E N D
Geography Basic Knowledge & Tools
What is Geography? • Geography- the study of the earth and everything on it, includes: • People • Places • Regions • Cultures • Technology • Environments • As we try to learn about these categories we will need to use some tools.
What do we use to study Geography? • Maps- drawing of a place or region • Physical, Political, Special • Charts- graphic way of presenting information clearly • Graphs- way of presenting relationships between two or more things • Diagrams- way of presenting a large object in smaller terms
What are Maps? • As we stated earlier, maps are drawings of a place or region. There are three types: physical, political, and special. • Physical map- shows the physical features of a place or region (mountains, valleys, rivers, lakes, etc.) • Political map- shows the political bodies such as cities, states, countries, and continents and the boundaries between them. • Special map- shows a specific group of information about a place such as population density, per capita income, education level, climate region, etc.
Examples… Special Physical Political
How do we use maps? • Maps have several different parts that help you read the information presented. • Title- this device tells us what the map presents. • It is very useful for special maps! • Compass Rose- this device tells us the cardinal directions (north, south, east, west) • Scale- this device tells how to convert the distance between two or more places. • Map Key- this device tells us what symbols or colors represent on the map.
Legend Age Expectancy
Latitude and Longitude • The earth is divided into lots of lines called latitude and longitude.
Lines • Longitude lines run north and south. • Latitude lines run east and west. • The lines measure distances in degrees. Latitude Longitude
Where is 0 degree? • The equator is 0 degree latitude. • It is an imaginary belt that runs halfway point between the North Pole and the South Pole. Equator
P R I M E M E R I D I A N Where is 0 degree? • The prime meridian is 0 degrees longitude. This imaginary line runs through the United Kingdom, France, Spain, western Africa, and Antarctica.
Hemispheres • By using the equator and prime meridian, we can divide the world into four hemispheres, north, south, east, and west.
Charts • Way to present information in an easy to read form. • Most often charts are tables of information • Common types of charts are distance charts, calendars, flow (timeline) and tables. Example of a Flow Chart
How do we use charts? Where in the World was this person born? • Title- the title tells us what information is on the chart. It is usually at the top. • Columns- these run from the top to the bottom • Rows- these run from the left to the right • Columns and rows have headings that tell you what the information means in each.
Graphs • A graph is a visual way of presenting two or more relationships. • Some common types of graphs are: • Pictograph- pictures are used instead of numbers • Circle Graph- divides parts of a whole • Bar Graph- shows how much using the height or length of the bars • Line Graph- shows a comparison over time or distance
Examples of Graphs Line Graph Bar Graph Circle Graph Pictograph
Diagrams • Diagrams are pictures that are labeled so the reader can easily learn the parts. • In geography, we use diagrams to view the inside of the earth’s surface. • We also use diagrams to look at the solar system, plants, animals, and processes.