Download
1 / 48
480 likes | 765 Views
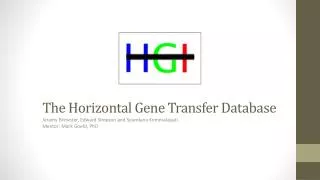
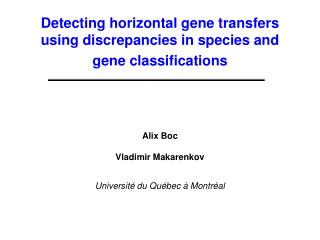
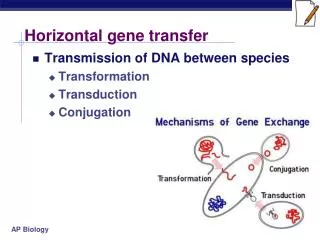
Detecting horizontal gene transfers using discrepancies in species and gene classifications. Vladimir Makarenkov and Alix Boc Université du Québec à Montréal. Presentation summary. Network models in phylogenetic analysis What is a horizontal gene transfer (HGT)?

E N D
Detecting horizontal gene transfers using discrepancies in species and gene classifications Vladimir Makarenkov and Alix Boc Université du Québec à Montréal
Presentation summary • Network models in phylogenetic analysis • What is a horizontal gene transfer (HGT)? • Description of the new method • Examples of application • Future works • T-REX software
Inferring phylogenetic trees • Four main approaches: • Distance-based methods • UPGMA by Michener and Sokal (1957) • ADDTREE by Sattath et Tversky (1977) • Neighbor-joining (NJ)by Saitou and Nei (1988) • UNJ and BioNJ methods by Gascuel (1997) • Fitch by Felsenstein (1997) • Weighted least-squares MW by Makarenkov and Leclerc (1999) • Maximum Parsimony (Camin and Sokal 1965; Farris 1970; Fitch 1971) • Maximum Likelihood (Felsenstein 1981) • Bayesian approach (Rannala and Yang 1996; Huelsenbeck and Ronquist 2001)
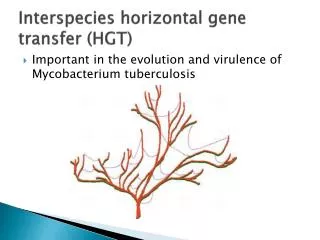
Phylogenetic mechanisms requiring a network representation • Horizontal gene transfer (i.e. lateral gene transfer) • Hybridization • Homoplasy and gene convergence • Gene duplication and gene loss
Software for building phylogenetic networks • SplitsTree, Huson (1998) • T-Rex, Makarenkov (2001) • NeighborNet, Bryant and Moulton (2002)
Methods for detecting horizontal gene transfers • Hein (1990) and Hein et al. (1995, 1996) • Haseler and Churchill (1993) • Page (1994); Page and Charleston (1998) • Charleston (1998) • Hallet and Lagergren (2001) • Mirkin, Fenner, Galperin and Koonin (2003) • V’yugin, Gelfand and Lyubetsky (2003) • Boc and Makarenkov (2003); Makarenkov, Boc and Diallo (2004)
The new model Basic ideas: Reconcile the species and gene phylogenetic trees using either a topological (Robinson and Foulds topological distance) or a metric (least-squares) criterion 2) Incorporatenecessarybiological rules into the mathematical model 3) Maintain the algorithmic time complexity polynomial
Partial gene transfer. Incorporating biological rules. Situations when a new HGT branch (a,b) can affect the evolutionary distance between species i and j, and cannot affect the distance between i1 and j.
Partial gene transfer. Incorporating biological rules (2). Three cases when the evolutionary distance between the species i and j is not affected by addition of a new HGT branch (a,b)
Partial gene transfer. Incorporating biological rules (3). No HGTs can be considered when affected branches are located on the same lineage
Partial gene transfer. Incorporating biological rules (4). No HGT can be considered when two HGTs affecting a pair of lineages intersect as shown
Partial gene transfer. Incorporating biological rules (5). • Cases (a) and (b): path between the leaves i and j is allowed to go through both HGT branches (a,b) and (a1,b1). • Cases (c) and (d) : path between the leaves i and j is not allowed to go through both HGT branches (a,b) and (a1,b1).
Algorithmic scheme Step 1. Construction of the species and gene phylogenies T and T1 • Let X be a set of n taxa (i.e. species or objects). • Infer a binary species phylogenetic tree T from the sequence or distance data (using 16S or 23S rRNAs or other genes that are not supposed to be transferred horizontally). This tree has 2n-3 branches and n leaves. • T is explicitly rooted. • Consider the same n taxa from X. Infer a binary gene phylogenetic tree T1.
Algorithmic scheme Step 2. LS mapping of the gene tree into the species tree • If the topologies of T and T1 are identical, no horizontal gene transfers can be indicated. • If the topologies of T and T1 are different, it may be the result of horizontal gene transfers. The gene tree T1 can be mapped into the species tree T by fitting by least squares the branch lengths of T to the pairwise distances in T1 (Bryant and Wadell 1998; Makarenkov and Leclerc 1999). • Each pair of branches of the species tree T is tested for the possibility of an HGT. All branch lengths in T are reassessed according to the pairwise distance in T1.
Algorithmic scheme Step 3. Unique and Multiple gene transfer scenarios Once all pairs of branches in T are tested, an ordered listL of all possible HGT connections between pairs of branches in T can be established. Each entry of L is associated with a gain in fit obtained for a particular HGT. The researchers can then either: • Choose the best (most probable HGTs) from this list taking into account the HGT order in L as well as any useful knowledge about the data at hand (Multiple Scenario). 2. Or, add to the species tree T the best second (according to the LS criterion), third, and so forth HGT branches in the way that the computation of each new HGT branch is done taking into account all previously added HGTs (Unique Scenario).
Optimization problem : Least-squares The least-squares loss function to be minimized with an unknown length l of the HGT branch (a,b): Q(ab,l) = + min d(i,j) - the minimum path-length distance between the leaves (i.e. taxa) i and j in the tree T (i,j) - the given dissimilarity value between i and j dist(i,j) = d(i,j) – Min { d(i,a) + d(j,b); d(j,a) + d(i,b) }
Complete gene transfer 1 3 2 Species Tree Upcoming HGT1 Species Tree + HGT1 Upcoming HGT2 Species Tree + HGT2 Upcoming HGT3 Species Tree + HGT3 (Gene Tree)
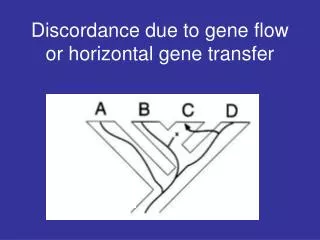
Optimization problem : Robinson and Foulds topological distance The topological distance of Robinson and Foulds (1981) between two phylogenetic trees is equal to the minimum number of elementary operations consisting of merging or splitting vertices necessary to transform one tree into another.
Robinson and Foulds topological distance Robinson and Foulds distance between T and T1 is 2. The HGT minimizing the Robinson and Foulds topological distance between the species and gene phylogenetic trees can be considered as the best candidate to reconcile the species and gene phylogenies.
HGT detection algorithm : Complete transfer • Test all connections between pairs of branches in the species tree T. • Compute the RF distance or LS coefficient for each connexion. In the case of LS optimization, the length of each edge of the species tree is reassessed according to the gene distance matrix. • The best HGT found (i.e. HGT minimizing the optimization criterion) is added to the species tree transforming it into another phylogenetic tree. • Run the algorithm while the transformed species tree is topologically different from the gene tree. • Time complexity: O(kn4)for k HGTs and n species.
Application example 1 Horizontal transfer of the Rubisco Large subunit gene Delwiche, C.F., and J. D. Palmer. 1996. Rampant Horizontal Transfer and Duplication of Rubisco Genes in Eubacteria and Plastids. Mol. Biol. Evol. 13:873-882.
Delwiche and Palmer (1996) - hypotheses of HGTs 1- Cyanobacteria → γ-Proteobacteria 2- α-Proteobacteria → Red and brown algae 3- γ-Proteobacteria →α-Proteobacteria 4- γ-Proteobacteria →β-Proteobacteria
HGTs of the rbcL gene - comparison Hypotheses by Delwiche and Palmer (1996) 1- Cyanobacteria → γ-Proteobacteria 2- α-Proteobacteria → Red and brown algae 3- γ-Proteobacteria →α-Proteobacteria 4- γ-Proteobacteria →β-Proteobacteria Solution 1. α-Proteobacteria → Red and brown algae 2. a-Proteobacteria →β-Proteobacteria 3. b-Proteobacteria →γ-Proteobacteria 4. b-Proteobacteria →a-Proteobacteria 5. γ-Proteobacteria →β-Proteobacteria 6. γ-Proteobacteria →Cyanobacteria 7. γ-Proteobacteria →β-Proteobacteria
Application example 2 Horizontal transfers of the protein rpl12e Data taken from: Matte-Tailliez O., Brochier C., Forterre P. & Philippe H. Archaeal phylogeny based on ribosomal proteins. (2002). Mol. Biol. Evol. 19, 631-639.
Rpl12e HGTs Assumed HGTs of the rpl12e gene involved the clusters of Crenarchaeota and Thermoplasmatales (Matte-Tailliez, 2004) Species tree Rpl12e gene tree
Future developments • Maximum Likelihood model • Maximum Parsimony model • Validation methods (bootstrapping) • Decreasing the running time
Bibliography • Boc, A. and Makarenkov, V. (2003), New Efficient Algorithm for Detection of Horizontal Gene Transfer Events, Algorithms in Bioinformatics, G. Benson and R. Page (Eds.), 3rd Workshop on Algorithms in Bioinformatics, Springer-Verlag, pp. 190-201. • Delwiche, C.F., and J. D. Palmer (1996). Rampant Horizontal Transfer and Duplication of Rubisco Genes in Eubacteria and Plastids. Mol. Biol. Evol. 13:873-882. • Makarenkov,V. (2001), T-Rex: reconstructing and visualizing phylogenetic trees and reticulation networks. Bioinformatics, 17, 664-668. • Makarenkov, V., Boc, A. and Diallo A.B. (2004), Representing Lateral gene transfer in species classification. Unique scenario, IFCS’2004 proceedings, Chicago. • Matte-Tailliez O., Brochier C., Forterre P. & Philippe H. (2002). Archaeal phylogeny based on ribosomal proteins. Mol. Biol. Evol. 19, 631-639. • Robinson, D.R. and Foulds L.R. (1981), Comparison of phylogenetic trees, Mathematical Biosciences 53, 131-147.
T-REX — Tree and Reticulogram Reconstruction1 Downloadable from http://www.info.uqam.ca/~makarenv/trex.html Authors: Vladimir Makarenkov Versions: Windows 9x/NT/2000/XP and Macintosh With contributions from A. Boc, P. Casgrain, A. B. Diallo, O. Gascuel, A. Guénoche, P.-A. Landry, F.-J. Lapointe, B. Leclerc, and P. Legendre. ________ 1Makarenkov, V. 2001. T-REX: reconstructing and visualizing phylogenetic trees and reticulation networks. Bioinformatics 17: 664-668.
Six methods for inferring phylogenetic trees from distance data Three methods for reconstructing reticulograms (phylogenetic networks) Methods available
Methods available • Four methods for inferring phylogenetic trees from incomplete distance data • Visualization and interactive manipulation of phylogenetic trees and networks
Phylogenetic tree inferring methods • ADDTREE by Sattath et Tversky (1977) • Neighbor-joining (NJ) by Saitou and Nei (1988) • UNJ and BioNJ methods by Gascuel (1997) • Circular order reconstruction by Makarenkov and Leclerc (1997) • Weighted least-squares MW by Makarenkov and Leclerc (1999)
Tree reconstruction with missing data • Ultrametric procedure by De Soete (1984) • Additive procedureby Landry et al. (1996) • Triangles by Guénoche and Leclerc (2001) • MW* by Makarenkov and Lapointe (2004)
Reticulogram reconstruction methods • Reticulogram with detection of reticulate evolution processes, hybridization, or recombination events (Legendre and Makarenkov 2002; Makarenkov and Legendre 2004). • Reticulogram with detection of horizontal gene transfer among species. Complete and Partial gene tranfer models. Unique and Multiple scenarios (Boc and Makarenkov 2003; Makarenkov, Boc and Diallo 2004). • Graphical representations: Hierarchical, Axial, or Radial views. Interactive manipulation of trees and reticulograms.
Tree reconstruction options Bioinformatics software
T-Rex output Bioinformatics software
Results available (tree map + HGTs) Bioinformatics software
Reticulogram : Hierarchical view Bioinformatics software
Reticulogram : Axial view Bioinformatics software
Reticulogram : Radial view Bioinformatics software
Color selection option Bioinformatics software
Copy as Bitmap or Metafile Bioinformatics software