Download
1 / 63
680 likes | 795 Views
On Time Graduation. Weaving a Safety Net for Each Student Everett Public Schools 3/30/07. Goals . NCLB 85% of On-Time Graduates by 2014 Community/Parents 100% of their children right now Work Force Prepare students for entry into high skilled and high wage jobs College

E N D
On Time Graduation Weaving a Safety Net for Each Student Everett Public Schools 3/30/07
Goals • NCLB • 85% of On-Time Graduates by 2014 • Community/Parents • 100% of their children right now • Work Force • Prepare students for entry into high skilled and high wage jobs • College • Students ready to engage in college level course work without remediation
High School Graduation • An Educational Mandate • An Economic Necessity • A Civil Right • A Moral Imperative
On Time Graduation Task Force 2004 • Members • Counselors • Teachers • Administrators • Focus – Improving Graduation Rate • Intervention • Communication • Data
On Time Graduation Task Force 2004 • Recommendations • Examine Policies and Procedures to eliminate barriers to graduation • Hire Success Coordinators to guide students through the process • Promote students by credit • Increase opportunities for students to make-up credit (summer and online) • WASL Credit Recovery • Develop process to validate and track student data • Increase communications to parents about student progress
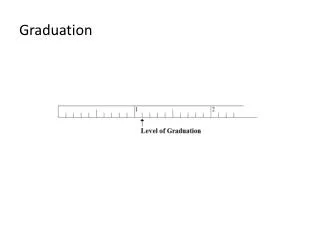
22.0 Credits 3.5 English 3.0 Math 2.0 Science 2.5 Social Studies 1.0 Art 1.0 CTE 2.0 PE/Health 0.5 Senior Seminar 6.5 Electives WASL Reading Writing Mathematics Science (2010) Argumentative Paper Culminating Exhibition Four Challenges to Graduation
Credits Shared Data Model District School Classroom
Credits • District - Initiatives • Policy Revision • Course Of Study Sequence • Directed Athletics • Washington State History at Middle School • IMS Parent/Student access • Program Options – Available for credit retrieval • Summer School • Online • SHS • Contract Learning • School - Initiatives • Develop High School Graduation Plan at Grade 8 • Transition Meetings • Personal Contact with failing Students • Teacher - Initiatives • Grading – Mid – Semester • 1 ‘F’ Student tracking
District • Policy Revision • Course Of Study Sequence • Directed Athletics • Washington State History at Middle School
Credits English 3.5 Mathematics 3.0 Science 2.0 Social Studies 2.5* World History 1.0 US History 1.0 Government .5 CTE 1.0* Info Tech .5 CTE .5 Credits Art 1.0 PE/Health 2.0* Senior Seminar .5 Electives 6.5 Recommendations
Recommendations (Continued) • Additional Changes • Students must take English, Mathematics and Science until they meet standard on the WASL • Students will have the opportunity to meet WA State History requirement in Middle School • Students will be able to earn up to 1.0 credit of PE by participating in Directed Athletics, Marching Band or ROTC
Recommendations (Continued) • Students who meet standard on the WASL will be allowed to retrieve a 0.5 credit of a previously failed course in the subject area of the test. Students can retrieve a 0.5 credit of English by meeting standard on the Reading WASL, a 0.5 credit in English be meeting standard on the Writing WASL, a 0.5 credit in Mathematics by meeting standard on the Mathematics WASL and a 0.5 credit in Science by meeting standard on the Science WASL.
Recommendations (continued) • Courses lower than Algebra will not count for mathematics credit. The usual course sequence for mathematics, will be Algebra, Geometry and Algebra II with Trig. • Courses lower than Coordinated Science will not count for science credit. The usual course sequence for science, will be Coordinated Science and Biology.
Recommendations (Continued) • Alignment of Current District Practices • College/University in the High School • Running Start • Student TA’s • Community Service
District • IMS Student/Parent Access • Program Options – Available for credit retrieval • Summer School • Online • SHS • Contract Learning
School • Develop High School Graduation Plan at Grade 8 • Transition Meetings • Personal Contact with failing Students • Success Coordinator/Counselors/Drug Alcohol Interventionists • Grading Practices
Classroom • Academic • 1F information provided to teachers • Attendance • Tracking relationship between failure and attendance • Behavior • Tracking relationship between behavior and attendance • Grading • Do grading practices reflect academic achievement, or attendance or behavior?
Intervention Focus – From Numbers to Names • District • U-C-D • School • 1F to 6F’s • Department/Classroom • Number of classes with failure rate over 25% • Course Grade Distribution
Jackson High School From Numbers to Names The Power of Relationships
Single F Reports • Teachers upload progress reports to server • The progress reports are available for parents to review • Teachers are asked to update progress reports every two weeks at a minimum • District has provided an application that summarizes progress report data • The application can be used to sort for a variety of things • I use it to determine the students that are only failing one class
Single F Report • Teacher/course percent • Peer percent • Student Name and times on report • Report is generated every two weeks • Historical data is collected by teacher/course
Next Phases • Include survey material • Collect reasons for students failing • Add a report for two F’s • Decrease in single F’s leads us to move to next stage
Processing Reports with Teachers • Administrator discussions about format of report and the use of the data • Decision to give peer comparison data • Want teachers to be able to identify how they compare to peers • Planning period meetings to present rationale for and the format of the report
Next Step • Teachers now have a report- what do they do with it • Identified Pyramid of Interventions during the 2005-2006 school • Our Pyramid of Interventions formalized opportunities we had available to us to support students
Academic Intervention • 2007-2006 funding prevented the use of the Academic In-School Suspension program and In-School Tutorial • Still in place was WAC Time, SSR Support, After School Tutorials(I-728 and PAS) • Planning period tutorials
Impact Upon Failing Grades • Fall Quarter 2006 • 1170 failing grades were given • First Semester Grades 2007 • 776 failing grades were given • From November 1, 2006 to January 30, 2007 there was a decrease of 394 failing grades • This was a 33.7% decrease in failing grades
Impact on Failing Grades-Red/Yellow/Green Report (RYG) • RYG report is a graduation trajectory report of credits earned • Freshmen (first semester) • Red- .5 and below • Yellow- 1-2.5 • Green- 3.0 and above • Sophomores (first semester) • Red- 6.5 and below • Yellow- 7-8.5 • Green- 9.0 and above • Juniors (first semester) • Red- 12.5 and below • Yellow- 13 -14.5 • Red- 15.0 and above
Impact on Failing Grades-Red/Yellow/Green Report (RYG) • Seniors (first semester) • Red- 18.5 and below • Yellow- 19 – 20.5 • Green- 22.5 and above
Graduation Trajectory for the Class of 2009 348 307 108 74 80 20
Graduation Trajectory for the Class of 2008 266 251 98 90 77 86
Graduation Trajectory for the Class of 2007 266 257 132 102 78 82
Data Needed for Interventions • Formative • IMS System • ‘F’ Lists to Teachers • Challenging course enrollment • Demographic Information • Course Codes for comparing over time
Data Needed for Interventions • Summative • Red-Yellow-Green • By School/District • Student names • Course Grade Distribution • Course/Teacher • Number/Percent of class with 25% or more failing • F and FINC Distribution • Course and Teacher • 1 to 6 • Quarterly Summary • WASL Mastery and Course History
Recommended Procedure • U-C-D data • Is your Data clean? • Have you tracked down U’s? • Have clear record for course codes • Allows for tracking and course histories • Identify Barriers to Graduation • Use data to help teachers shift perception about failing students • Need to shift school district culture from student failure to student success
Recommended Procedure (continued) • Establish Data Summary Points and which data will be consistently collected • Principal must ‘own’ and report to superintendent on progress toward improvement • R-Y-G baseline and summary at grading periods • Review policies about grading, attendance and graduation requirements to check for self inflicted wounds • Work with students to see every class as important, that credit matters and that graduation is possible • Develop Options for Credit Recovery
Recommended Procedure (continued) • Look for High Failure Rate classes • Are they Barriers • What changes can be made to remove barriers while maintaining rigor • Graduation Requirements • Other ways for students to earn credit or make space • PE • WASL Credit Recovery
On Time Graduation • Role of Accurate Data • U-D-C-T • IMS-2 • Real time data for student intervention • Pentamation • Red-Yellow-Green • Grade distribution • Individual Class Failure Rates
Next Steps: • Culminating Exhibition • Annual Review of program • Transition to IMS2 • Continue Quarterly Meetings with Principals and Superintendent • Summer School Option for entering 12th grade students • Last summer 44 incoming seniors completed
Next Steps • Argumentative Paper • Transition to IMS2 • Integration of Argumentative Paper with CCBA for Social Studies • Continue Quarterly Meetings • Continue tracking and extended learning opportunities for completion
Next Steps • WASL • Classes • Learning Support Classes • Segmented Math • WASL Prep classes • Extended Day Activities • Continued Curriculum Alignment • Staffing • Facilitators at Middle and High School • Success Coordinators • Data • Student Tracking • WASL Course History Alignment
Next Steps • Credits • Data Tracking - Students • ‘F’ Distribution • Teachers/Success Coordinators/Drug Alcohol Interventionists • Red-Yellow-Green • Student meetings and Grad Intervention Plans • Data Tracking – Staff • ‘F’ Course Distribution • Grade Distribution • Professional Development – Grading Practices
Next Steps • Technology • Continue U/D/T Dropout Tracking • Process for continued monitoring • Develop an electronic transcript evaluation tool • Teacher, Counselor, Student and Parent Access • Develop an electronic 4 Year Graduation Plan • Teacher, Counselor, Student and Parent Access
Next Steps • Providing Challenging Options • Increase access and enrollment • GEAR UP • Summer Program • AVID • Summer School – Accelerated Coordinated Science • Increasing College in the High School Offerings in 07/08 – Social Studies
Next Steps • Attendance – Middle School • Gateway/Eisenhower • Target students 70% - 85% attendance • Goal to re-engage in school • Provide school based incentives • Tracking students and control group to monitor success of program
Next Steps • Attendance (continued) • Gateway/North • Counselors meet with students with 3 or more absences in 3 week period • Student contract • Attendance support group
Next Steps • Evaluate Effectiveness of Attendance Interventions • Expand if appropriate • Develop Appropriate Attendance Interventions for Elementary School
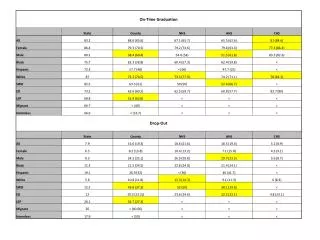
Progress *Alternative School Graduation rate based on inflated enrollment mobility.