Download
1 / 49
490 likes | 733 Views
Changing nature of South-South trade: Implications for world trade prospects. Sudip Ranjan Basu* UNCTAD, Geneva. Project LINK Spring Meeting St. Petersburg International Economic Forum St. Petersburg , Russia 4-6 June 2009.

E N D
Changing nature of South-South trade: Implications for world trade prospects Sudip Ranjan Basu* UNCTAD, Geneva Project LINK Spring Meeting St. Petersburg International Economic Forum St. Petersburg , Russia 4-6 June 2009 *The views expressed in this presentation are those of the author and do not necessarily reflect the views of the UNCTAD Secretariat or its members.
South-South trade expansion: A big picture view
Synchronized downturn Trade and Growth $ billions Percent Source: UNCTAD, Bloomberg
LINK factors…. South-South exports(Developing countries exports to North and South) $ billions Source: UNCTAD
South-South exports: South to North ratio (Developing countries) $ billions Percent South to North ratio(right axis) Source: UNCTAD
Transition economies exports: South to North ratio (Transition economies) $ billions Percent Source: UNCTAD
Emerging economies exports: South to RoW ratio (Seven emerging economies*) $ billions Percent *Brazil, China, India, Mexico, Russia, South Africa and South Korea Source: UNCTAD
Highlights Increasing market share of South(Developing and Transition economies exports to World) Percent Source: UNCTAD
But Regional differences high in South(Developing and Transition economies exports to World ) Regional exports to World Regionalexports to South Percent Source: UNCTAD
Regional exports: Africa, Americas and Asia (Developing countries) Regions to RoW ratio (right axis) Percent $ billions Source: UNCTAD
LDCs, SVEs, LLDCs and SIDS exports: (Developing countries) Regions to RoW ratio (right axis) Percent $ billions Source: UNCTAD
No to “protectionism” Market access* and exports: (Developing countries and transition economies) Log(exports) Index value Exports *Higher market access implies lower index value Source: Basu (2009), UNCTAD
Nature of South-South trade expansion: Going beyond aggregates
Structural transformation in South exports(Share of developing countries exports to World) A: Primary commodities, B: Labour intensive and resource based manufactures C: Manufactures with low skill and technology intensity, D: Manufactures with medium skill and technology intensity, E: Manufactures with high skill and technology intensity F: Energy products, G: Unclassified Source: UNCTAD 14
Structural transformation in exports(Share of transition economies exports to World) A: Primary commodities, B: Labour intensive and resource based manufactures C: Manufactures with low skill and technology intensity, D: Manufactures with medium skill and technology intensity, E: Manufactures with high skill and technology intensity F: Energy products, G: Unclassified Source: UNCTAD
Primary commodities(% share of share of national exports,developing and transition) Change: 1995-2007
Labourintensive and resource based manufactures (% share of share of national exports,developing and transition) Change: 1995-2007
Manufactures with low skill and technology intensity (% share of share of national exports,developing and transition) Change: 1995-2007
Manufactures with medium skill and technology intensity (% share of share of national exports,developing and transition) Change: 1995-2007
Manufactures with high skill and technology intensity (% share of share of national exports,developing and transition) Change: 1995-2007
Energy products(% share of share of national exports,developing and transition) Change: 1995-2007
Structural transformation in South exports?(Share of developing countries exports to World) Percent Source: UNCTAD
Structural transformation in transitions economies exports? (Share of ETran exports to World) Percent Source: UNCTAD
Structural transformation in emerging economies exports? (Share of E7 exports to World) Percent Source: UNCTAD
Structural transformation in LDCs exports? (Share of LDCs exports to World) Percent Source: UNCTAD
Structural transformation in SVEs exports? (Share of SVEs exports to World) Percent Source: UNCTAD
Structural transformation in LLDCs exports? (Share of LLDCs exports to World) Percent Source: UNCTAD
Structural transformation in SIDS exports? (Share of SIDS exports to World) Percent Source: UNCTAD
Russian story(% share of share of national exports) Per cent
Understanding structural transformation: Preliminary empirical findings
Identifying constraints Determinants of trade expansion and development (Trade and Development Index) Index Source: Developing Countries in International Trade 2007: Trade and Development Index. United Nations, UNCTAD, Geneva and New York, 2007
Developing economies’ merchandise exports grew from 1.4 trillion USD in 1995 to 5.2 trillion USD in 2007 • The transformation of developing countries exports structure has been diverse leading to a differential level of impact on their national economic growth and development. • Two key issues: • The proponents of open-global economy and free trade argue that product diversification help accelerate economic growth and development in countries which favored these set of policies. • On the other hand, another set of economists argue that a cautious approach in conjunction with good and strategic domestic economic policies can better help countries to obtain fruits of export diversification leading to rising skill/technology content of products help countries to transform their domestic production structure.
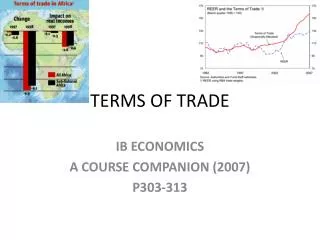
Classical arguments • Prebisch-Singer (1950) hypothesis indicate that (trade) concentration is linked to deteriorating terms of trade, income volatility, shrinking production structure that lead to low-level equilibrium trap. • Trade (export) diversification and skill/technology content in production process is key for developing countries to overcome domestic economic and structural bottlenecks, especially in Africa • Welfare impacts: economic growth and employment creations • Sectoral implications: Depending on the institutional linkages and stages of development, welfare implications tend to be higher in high skilled/technology content industries, and new issues related to intensive and extensive margin • Domestic economic linkages: Forward and backward linkages with domestic firms leading to a productive capacity and expand structure
Trade as engine of growth Continuing discussions • 1940s-1980s: • Harschman (1945), United Nations (1950), Michaely (1958), Massell (1964) • 1990s-2000: • Grossman and Helpman (1991), Sachs and Warner (1995), Lall (2000) • 2001 onwards: • Wood and Mayer (2001), • Lederman and Maloney (2003), Imbs and Wacziarg (2003), Hausman and Rodrik (2003), Collier (2003) • Sachs et al. (2004) • Hausman, Hwang and Rodrik (2005), Melitz and Ottaviano(2005), Rodrik (2006) • UN Africa (2007) • Cadot, et al (2008) • World Bank (2009) • UNCTAD (2002, 2008 & 2009)
Identification Some empirics • Three key issues: • New database and measures • Exploring importance of institutions along with economic polices, infrastructure, and geography as determinants of factor intensity differences in developing countries • These results are robust to different specifications, estimation methods, and additional control variables • Cross section model • Panel model • 170 countries, whole sample • Period of analysis 1995-2007
Exploration Database and measures • 170 countries , whole sample (developing and transition, 130+) • Time periods: • 1995 to 2007 • Four time periods: 1995-1997, 1998-2000, 2001-2003, and 2004-2007 • Trade database • UNCTAD South-South Trade Information System (SSTIS) • Product Classification at HS-6 digit level • Time series ensured soon • Institutional Quality, Foreign Market Access, Economic Policy and Geography • Factor intensity categories: • UNCTAD SSTIS database, HS-4 digit level • Other data (Economic policy, Infrastructure, Geography etc): • UNCTAD, World Bank, IMF, WTO, HF/Cato, CIRI, and other sources
Factor intensity Measuring factor intensity • Harmonised System of trade classification, HS-4 digit level, based on UNCTAD SSTIS • Factor intensity categories: A to G. A:Primary commodities B:Labour intensive and resource based manufactures C:Manufactures with low skill and technology intensity D:Manufactures with medium skill and technology intensity E:Manufactures with high skill and technology intensity F:Energy products G:Unclassified products
Measuring quality.. Measuring quality of institutions Property Rights, Rule of law, Corruption, Financial measures, investment measures , Business accesses, Trade institutions; Political Rights, Civil Liberties, Measures of, democracy and autocracy, Physical Integrity measures, parliamentary process and political participation; Measures of women’s empowerment, Labour rights, social rights and press freedom Methodology Multivariate Statistical Method of latent variable (LV) approach as proposed in Nagar and Basu (2002), Basu, Klein and Nagar ( 2005) -A composite weighted average measure of standardized indicators for each country for each period defined, without scaling the final index values -IQI is a latent variable, and linearly determined by many exogenous variables say, X1, …, XK. -Variation in these variables explain variation in IQI. -Weights are obtained to compute weighted average of IQI
Income and FI categories (Developing countries) Some correlates 39
Institutions and FI categories (Developing countries) Differential impacts 40
Specifications Empirical Methodology • Empirical Model Specification: • Core specification (OLS) in Cross-section analysis • Dep.var: Factor intensity category (A to G) • Indep.Vars: Institutions, economic policies and geography • Further issues: • Reverse causality: • Dealing with endogeneity • 2SLS-IV and GMM-IV specification • Choice of appropriate specifications • Panel data: • Fixed effects estimates • System GMM
Empirics Model specification • IQI=institutional quality index • EPOL: economic policy, infrastructure, financial variables • GEOG: geography variable (distance from equator) • Core cross-section specification • Reverse causality and instruments
Model specification: Panel data • Core panel specification • Dynamic panel specification (AB/BB)
Robustness checks Further exploration • Independent variables: • Macroeconomic: Inflation, REER, Fiscal Balance • Financial: Credit to private sector • Infrastructure: Telephone lines, Road, Railway • Geography: Tropical, Population close to coast • Natural Resource: Fuel, Arable land • Level of development: Non-linearity of GDP pc
Policy variables Cross-section
Policy variables Cross-section (developing countries)
Summary Conclusions • Preliminary results identify the positive role of institutional quality in determining stages of factor-contents of developing countries exports during 1995-2007. • In the benchmark model specification, the higher level of institutional quality, along with economic policies and other related factors, leads to higher factor-contents of technology related exported products. • Results can answer some specific issues related to regions that help us to understand the new-geography models of trade theory. It also indicates the key role of supply side factors and/or the domestic policies in understanding the transformation of countries trade structure. • The analysis is important to understand the climbing up of ladder by South-South economies in new geography of international trade. • Need to re-emphasize the hand-in-hand approach in making institutional quality and supply-side factors to work together to raise policy coherence and help develop inclusive trade and development strategy at the national level.
Thank you! Email: sudip.ranjan.basu@unctad.org Fax: +41 22 917 00 44 http://www.unctad.org