Download
1 / 56
560 likes | 731 Views
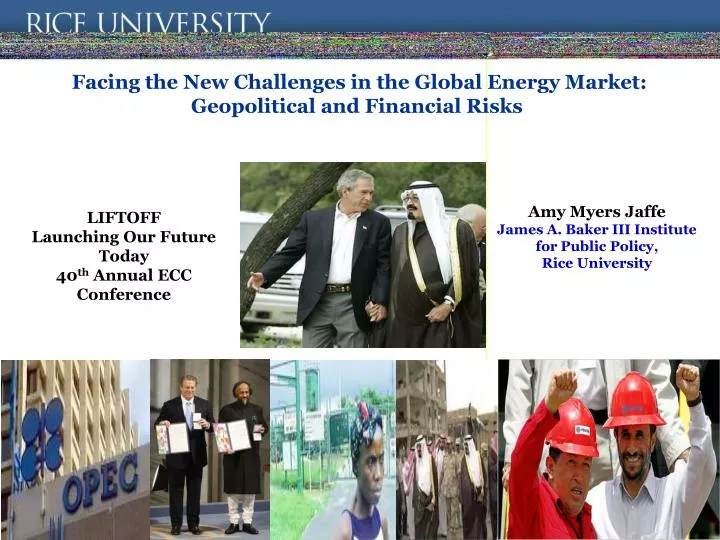
Facing the New Challenges in the Global Energy Market: Geopolitical and Financial Risks. Amy Myers Jaffe James A. Baker III Institute for Public Policy, Rice University. LIFTOFF Launching Our Future Today 40 th Annual ECC Conference. February 14, 2008. Key Finding.

E N D
Facing the New Challenges in the Global Energy Market: Geopolitical and Financial Risks Amy Myers Jaffe James A. Baker III Institute for Public Policy, Rice University LIFTOFF Launching Our Future Today 40th Annual ECC Conference February 14, 2008
Key Finding Many of the risks that originally created the so-called “terror premium” have eased in the past year and this is now reflected in downward oil price trends. Other factors, related to the dollar and financial market trends, created a bubble effect that clouded fundamentals. In the end, fundamentals do reassert themselves. Oil is a cyclical industry and it is hard to defy that reality.
Geopolitical Risk from Middle East Tensions and Conflict in the Middle East at a lull. Israel in negotiations with Syria. Violence in Iraq on a downswing, reducing chances of a spread to regional conflict. Iranian politics in a transition.
Geopolitical Risk from Iran Iranian spring election results an indication that economic sanctions are working. Iran’s political conservatives’ concrete interests in promoting greater foreign investment and attaining a larger measure of autonomy for the private sector, put together with their current political rapprochement with domestic reformist groups could translate into a more flexible position on the nuclear issue. There is a greater possibility of diplomatic negotiations with the West than in the past.
Geopolitical Risk from Al-Qaeda Starting in 2004, the attitude towards oil shifted and Al-Qaeda writings refocused on how supplying oil to the enemies of Islam justified the destruction of oil facilities by any means necessary. But Al-Qaeda assessed as having been weakened. • Attacks are aimed to destroy the economic basis of the kingdom rather than allow anyone collaborating with the United States to benefit from the oil • Prominent ideologue and strategist for global radical Islam Abu Musa`b al-Suri set a strategic direction of autonomous cells carrying out terrorist operations and focused specifically on the oil industry –a strategy which appears to have been adopted both by Al-Qaeda and a number of ideological affiliates However, local and autonomous aspect of terror cells, in the aftermath of theU.S. military campaign in Afghanistan which disrupted some of Al-Qaeda’s global coordination capability, has reduced the chances of a successful strike against major oil facilities that requires expert coordination, planning and material support.
Scenario: Russian six month cutoff of natural gas supply to Europe—Extreme price impacts but market adjustments possible starting after a year $9.00 $8.00 $7.00 $6.00 $5.00 $/Mcf $4.00 $3.00 $2.00 $1.00 $0.00 $-1.00 2008 2009 2010 2011 2012 2013 2014 2015 2016 2017 2018 Henry Hub German-Austria Border Sydney NBP Tokyo
Scenario: Russian six month cutoff of natural gas supply to Europe—Supply Impacts. LNG impacts mean supply adjustments divided among many players, not just EU 2 1 Tcf per year 0 -1 -2 -3 -4 2005 2010 2015 2020 2025 2030 2035 2040 Russia Ukraine East of Caspian Rest of World
Contagion, Petrodollar Recycling and Financial Crises *Current potential for market contagion means sagging US economy or banking crisis could become global *High oil prices worsen U.S. trade deficit and create asset bubbles *Debt accumulation started commodity and asset bubbles *Hot money from Middle East flowing around the world ala the 1970s *Escalating U.S. debt (combined with rising developing world debt) could threatening global financial system if U.S. creditors (Asia and GCC) become fearful and begin to switch away from the dollar *End of the dollar-standard era? Will it be orderly transition or chaotic crisis? *Is it the 1970s all over again??? Did the Fed really learn from its mistakes about interest rates, stagflation and monetary policy?
The effect of the weakening $ Source: Medlock (2008) • It is no coincidence that the price of oil hits all time highs as the dollar sinks to new lows. Since May 2003, when oil price was $28.18, the depreciating $ accounts for roughly $50 of the $100 increase. • In fact, a stronger dollar yields a very different picture of oil price. • Construction: Use the $-Euro exchange rate to calculate the Euro price of oil. Then, convert this price back to $ using the $-Euro exchange rate from the year 2000. This is a “ceteris paribus” argument, so a different exchange rate may very well lead to a different supply-demand balance. • Supply-demand fundamentals would have, nevertheless, pushed oil prices over $78, which would have been new territory.
The number of deepwater drilling rigs is about to increase exponentially Average Deepwater Rig Day-Rates Deepwater Rigs under construction – Now let’s see if we get a supply response! ________________ Source: ODS-Petrodata and Lehman Brothers Estimates 15
Refinery capacity expansion to outpace product demand Refinery capacity additions could outpace demand growth in 2010 by 2:1 Refinery investment had not kept up with rapid demand growth in recent years, but we are approaching a turning point, especially East of Suez Global UpgradingCapacity Additions (k b/d)(1) Global CDU CapacityAdditions (k b/d) • ________________ • Source: Lehman Brothers Estimates. • Includes coking, catalytic cracking, and hydrocracking units and expansions. 12
Latest Demand Trends May 2008 Source: Energy Intelligence
Latest Demand Trends July 2008 Source: Energy Intelligence
Will Dependence on NOCs Collide with Pent Up Demand in Developing World? Geopolitics is driving our energy future. There are many reasons to remain concerned about a major supply disruption that could affect mobility. The restructuring of the oil industry means that we are going to be more dependent on national oil companies to produce future energy supply. Longer term, given this restructuring, the future oil supply may fail to materialize in the volumes we expect and need. There exists a vast pent up demand for automobiles and electricity in the developing world that will be hard to meet long term without a breakthrough change in the status quo.
Control of World Oil Reserves Majority of remaining oil resources are controlled by traditional state monopolies and emerging partially privatized firms.
NOCs have important national goals and priorities that go beyond the maximization of return on capital to shareholders. NOC national priorities sometimes interfere with these firms’ abilities to maximize the value of oil resources; replace reserves; expand production in line with market opportunity; and meet performance goals in line with best practices in international industry. Examples Goal • Oil wealth redistribution to society at large • Fuel at subsidised prices • Wealth creation for the nation • Contribution to national GDP • Fund for future generations • Industrialization and economic development • Local content programs • Energy security, including assurance of domestic fuel supply and security of demand for producing nations • Ensure no domestic fuel shortages • Foreign and strategic policy and alliance building • Oil Diplomacy and advisory role to national leaders • Participation in national level politics • Leadership with greater political aspirations and involvement of unions and employees in national politics
NOC Efficiency Technical Efficiency • On average, NOCs that are fully government-owned and sell petroleum products at subsidized prices, will be only 35 percent as technically efficient as a comparable firm which is privately held and has no obligation to sell refined products at discounted prices. • Most of the NOCs in OPEC countries offer subsidized fuel prices. While individual firms may vary in efficiency, on average government held firms in general exhibit only 60 to 65 percent of the efficiency of the privately-held international oil majors Revenue Efficiency • Our analysis shows that there is a large difference in the revenue efficiency growth which could be achieved through process improvement and better integration: • IOCs: In the range of 10-20% growth • NOCs: In the range of 30-90% growth Overall Many NOCs are 80 percent or more below the frontier of the most efficient firms in the industry 50 percent of that gap in efficiency is accounted for by: • Their lack of vertical integration • The inefficiencies created by having to provide facilities to meet domestic product demand that is growing inefficiently largely due to subsidized prices • 100 percent government ownership • Some government interference in the businesses
Revenue Efficiency Revenue efficiency is measured as the percent of revenue a company achieves relative to “best practice” for a given level of reserves and employees. Percent Revenue Generated Relative to “Best Practice”
Geopolitical and Economic Implications • NOC’s national priorities sometimes interfere with the firm’s ability to: • Maximize the value of oil resources, • Replace reserves • Expand production, and • Perform in a technically efficient manner.
NOC Geopolitical Responses to Tightening Markets NOCs feel empowered by oil supply shortages and this will tempt them to flex their geopolitical muscle… • Russia increasingly assertive to defend its sphere of influence, using energy levers • Iran flexing spoiler power in the Persian Gulf • China becoming heavily embedded in producing countries; less trusting of market based system • Producers try to get more than economic gain; advance geopolitical and regional goals; Example: Venezuela trying to leverage geopolitical power from oil (the special problem of the Citgo assets) • Consumer nations seek geographic diversification of oil and gas supplies as well as alternative energy to respond to saber rattling by oil producers; Regardless of your view on Russian motivation, Ukraine affair was landscape changing event in Europe • Resource Wars Fear Literature: Could scarcity lead to greater conflict? Within oil producing countries? Between energy scarce countries?
Geopolitical and Economic Implications • NOCs are expected to control a greater portion of future oil production over the next two decades but they will have difficulty fulfilling this role • Many NOCs have stagnant (or falling) oil production due to civil unrest, government interference, corruption, inefficiency, and diversion of capital to social spending • Combined with the lack of spending of the largest IOCs, supply might fail to materialize in the volumes and time frame that it is needed, despite “price signals” for investment • Uncertainty about climate policy is another influence dampening the investment response
OPEC Investment Barely Keeps Pace with Losses from Iraq, Venezuela and Indonesia
The Largest Five IOCs represent 20 percent of non-OPEC Production with 9.7 million b/d and had $150 billion in operating cash flow in 2006 (compared to $50 billion for the next largest twenty American firms). Source: Baker Institute Working Paper: The International Oil Companies
The Largest Five IOCs spent 56 percent of operating cash flow in 2006 on stock buybacks and dividends. Source: Baker Institute Working Paper: The International Oil Companies
The Big Five Oil Companies (in Nominal US Dollars) Source: “The International Oil Companies,” The Changing Role of National Oil Companies in International Energy Markets, James A. Baker III Institute for Public Policy, Rice University (based on SEC filings)
The Next Twenty American Firms are spending the same amount on exploration as the Largest Five IOCs. Source: Baker Institute Working Paper: The International Oil Companies
The Largest Five IOCs are struggling to replace reserves. Source: Baker Institute Working Paper: The International Oil Companies
The market is not rewarding the majors for this strategy. Moreover, the NOCs do not need the majors for capital financing. NOCs can go directly to the markets and investors are rewarding the more commercial NOCS. Source: Baker Institute Working Paper: The International Oil Companies
Transportation Energy Use, Vehicle Stocks, and Economic Development • Countries such as China are at the “launching” point. So, we should expect vehicle stocks and transportation fuel use to grow very rapidly in those countries as they continue to develop. Note: Series are plotted on different scales in order to depict them in the same chart Source: Medlock and Soligo (2003)
IEA Reference Scenario:Increase in World Primary Energy Demand, 2005-2030 100% Rest of the world India 80% China 60% 40% 20% 0% Coal Oil Gas Nuclear Hydro Rest of Total renewables China & India will contribute about 45% of the increase in global energy demand to 2030 on current trends
Three Interacting Forces:Energy Security/Climate Change Legislation, Energy Consumption, and Technological Innovation • As climate change and security of supply grow into critical geopolitical issues, governments and consumers are searching for solutions • This is leading a movement to increasingly strict regulation and public sensitivity to security and environmental issues • Fuel and technology types will have to change to meet consumer and legislative expectations • Hybrid vehicles • Clean coal • Nuclear • Solar, Wind • Ethanol Future fuel mix will be driven by three interacting forces Figure source: Accenture
New Political Lexicon “We must treat energy security and climate security as two sides of the same coin” --Tony Blair, October 20, 2006 This is a mistaken notion. There is a conflict between the two that will need to be resolved through smart science and good policy.
Instruments and targets • Some policies can further both goals: • Increasing energy efficiency • Increasing non-fossil fuel sources • Some policies have conflicting effects: • Directly limiting the use of coal and unconventional oil • CO2 emissions constraints, which can artificially increase demand for natural gas • Climate change policies with no effect on energy security: • Increased sequestration • Climate damage adaptation and remediation
IEA Base Case Reference Scenario: Increase in World Oil Supply, 2004-2030 25 20 Other 15 mb/d Iran 10 Iraq 5 S.Arabia 0 OPEC conventional Non-conventional Non-OPEC conventional Under a business as usual scenario, world will increasingly rely on Persian Gulf and unconventional oil, including about 3.5 to 4 million b/d of Canadian tar sands production, 1.5 to 2 mb/d of upgraded heavy oil, 2.4 mb/d of gas to liquids and 1.7 mb/d of coal to liquids, oil shale, etc
CO2–intensity of fossil fuels Source: EIA
US electricity generation Generation by source 2006 Generating capacity 2005 Average annual net capacity growth 2005-2030 in the EIA Annual Energy Outlook, 2008 reference case
Concern about future CO2 regulation already is delaying new coal plants • Amount of coal capacity cancelled in 2007 is nearly the amount cancelled between 2004 and 2007 • Some cancellations are also the result of rising construction costs • But these also tend to favor less capital-intensive CCGT and also disadvantage nuclear in addition to coal • Despite the cancellations, some coal projects are still proposed • 2,800 of the 6,700 MW still proposed at the beginning of 2008 was IGCC Source: Wood Mackenzie
Restricting CO2 emissions • Natural gas, as the least CO2-intensive fossil fuel, will be favored • Increase the price of energy other than natural gas by 50% in OECD western Europe, North America and Asia, leave it unchanged elsewhere in the world • The increase in energy price will reduce the energy-intensity of GDP, but absent an increase in natural gas prices will raise the demand for natural gas • The endogenously calculated price of natural gas thus also will rise • In the US, the demand for natural gas to generate electricity is modeled conditional on the available capacities of the different types of plants • The estimated cross-price elasticity of substitution between fuels is lower in the US • In the restricted emissions case, we assumed that all the planned coal-fired capacity additions in the US were required to be natural gas instead • As in the reference case, we still allow substantial development of IGCC with sequestration, along with nuclear and renewables capacity
Access restrictions in the US • Relaxing restrictions on drilling in the US might satisfy some increased demand resulting from CO2 emission restrictions • Specifically, some Federal lands and offshore areas known to contain significant natural gas reserves are effectively off-limits • Some restrictions are via legislation, executive order, regulation or administrative decisions • Other resources have been rendered uneconomic by Federal and State regulatory requirements that increase costs and create delays • Major resources affected include interior Western States, some US offshore areas and the Alaska National Wildlife Refuge and some other areas in Alaska • Ultimately, the amount restricted will depend on gas prices and other costs
Outline of restricted areas Sources: NPC Supply Task Group Report, MMS