Download
1 / 32
320 likes | 445 Views
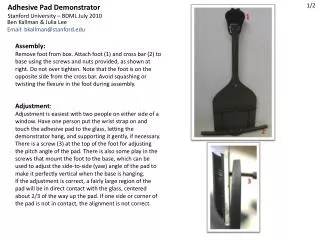
Quality adjustment procedures in HICP. Prepared by Oskars Alksnis, Central Statistical Bureau of Latvia EU Twinning Project Forwarding Armenian Statistics Through Twinning AM09/ENP-PCA/TP/04 Component E: Harmonized Consumer Price Index Activity E.3: Development of technical methodologies

E N D
Quality adjustment procedures in HICP Prepared by Oskars Alksnis, Central Statistical Bureau of Latvia EU Twinning Project Forwarding Armenian Statistics Through Twinning AM09/ENP-PCA/TP/04 Component E: Harmonized Consumer Price Index Activity E.3: Development of technical methodologies Yerevan 5-9 September 2011
Quality adjustment – EU legislation and recommendations • Legislation • COMMISSION REGULATION (EC) No 1334/2007 of 14 November 2007 amending Regulation (EC) No 1749/96 on initial implementing measures for Council regulation (EC) No 2494/95 concerning harmonised indices of consumer prices • Article 5: Minimum standards for replacements and quality adjustment • CENEX handbook • http://www.destatis.de/jetspeed/portal/cms/Sites/destatis/Internet/DE/Content/Publikationen/StatistikundWissenschaft/Band13__Handbook1030813099004,property=file.pdf
Quality adjustment methods • Most commonly used (known) methods for QA: • direct comparison • overlap • bridged overlap • option cost • (supported) judgmental adjustment • monthly chaining and resampling • hedonic methods • link to show no changes
Quality adjustment – recommended methods • Methods adapted or recommended at EU level (A or B methods out of the ABC ranking): • clothing and footwear – hedonic, direct comparison, bridged overlap or class mean imputation • books • long-selling market – direct comparison, bridged overlap • rapidly changing market – direct comparison • cars • new cars – option cost or bridged overlap • used cars – supported judgmental adjustment or bridged overlap • TVs, washing machines – direct comparison, bridged overlap
Quality adjustment – recommended methods (2) • cont. • computers • desktops – option cost, bridged overlap • notebooks - bridged overlap • software • applications and games – direct comparison • other durables – direct comparison or bridged overlap, • hedonic regression as alternative to above mentioned methods • other methods: overlap, quantity adjustment, judgmental adjustment, monthly resampling and chaining
Used cars in Latvian HICP • Two groups of used cars in the HICP basket: • 3-5 year old cars • 9-11 year old cars • Information on the weights from National Accounts, adjusted for latest changes in the market development • Detailed information on the breakdown by car models from Road Traffic Safety Directorate (CSDD) • Major part of used cars come from abroad, yielding significant consumption weight
9-11 year old cars • data source – advertisements from different websites • offer prices • many with many price comparison • sample structure (consumption segments) • medium size cars (Ford Focus, VW Golf, Opel Astra, etc.) • large size cars (Opel Vectra, BMW 5 series, Mazda 626, etc.) • minivens (Opel Zafira, VW Sharan) Used cars -> 9-11 year old cars
Comparability, Replacements and Quality adjustment • no reliable technical information is available • adjustment for the depreciation or age is carried out • additional stratification by type and capacity of engine Used cars -> 9-11 year old cars (3)
Comparability, Replacements and Quality adjustment • Example: Volkswagen Golf 10 and 11 year old cars (registration years 2000 and 2001) • Year is divided in 12 parts (months) • In February 2011 price for car 2000 registration year is 2100 LVL • In February 2011 price for car 2001 registration year is 2300 LVL • average price is adjusted for age as follows: • 2100 x 10 /12 + 2300 x 2 /12 = 2133 • In March 2011 price for car 2000 registration year is 2080 LVL • In March 2011 price for car 2001 registration year is 2270 LVL • average price is adjusted for age as follows: • 2080 x 9 /12 + 2270 x 3 /12 = 2128 Used cars -> 9-11 year old cars (4)
Used cars -> 3-5 year old cars • 3-5 year old cars • data source – car sellers / dealers (websites and outlets) • sample structure (consumption segments) • medium size cars (Mazda 3, VW Golf 5) • large size cars (Volvo V70, VW Passat, Toyota Avensis, Audi A4) • sport utility cars (Toyota RAV4, BMW X5) • minivens (Oper Zafira, VW Touran)
Used cars -> 3-5 year old cars (2) • Comparability, Replacements and Quality adjustment • Usual price collection and comparison like with like • If the selected product is not available, replacement is chosen within the framework of defined specification • better technical information normally is available • adjustments for the age and mileage is carried out • CENEX recommendations serve as basis for sampling, replacement strategy and quality adjustment
Used cars -> 3-5 year old cars (3) • Changes in the age or in the mileage of the car should be adjusted by supported expert judgement. • For each considered primary model in each age class one depreciation rate for age and one for mileage has to be calculated on a yearly basis • Approximately 10 price observations (5 pairs) is necessary for each depreciation rate • Important! When calculate depreciation rate for age, the mileage of the observation pairs should be very similar (nearly constant) whereas the age in months can vary within the interval of the considered age class and vice versa
Used cars -> 3-5 year old cars (4) • “delta” can be interpreted to be the absolute monetary value of 1 month of age for the considered primary model in the considered age class • The absolute monetary value of an additional mileage of 1000 kilometres for the considered primary model in the considered age class
Used cars -> 3-5 year old cars (5) • Limitations in Latvian case: • - some observations, which were collected for the age sample had also be applied for the mileage sample (and the other way round) - if they were appropriate; • - restrictions to the sub-models had been relaxed: observations came from the same primary models but could be of different sub-models; • - limitation to the age class was removed: one depreciation rate for age or mileage was calculated for all age classes of one primary model.
Used cars -> 3-5 year old cars (8) • Example • Previously observed model in 3-year old age class (VW Golf 5 Trendline 1.6l, diesel engine, price 8625 LVL (Latvian lats), mileage 27 900km, first registration 11.2007 = age 28 months) disappeared from the market and new similar representative model was chosen with price of 6255 LVL but with mileage 39 200 km and first registration 01.2007 = age 38 months. • The observed price in March 2010 had to be adjusted for 10 months and 11 300 kilometres:
Used cars -> 3-5 year old cars (9) • Example • Adjusted replacement price = 6255 + 79.27 x (38 – 28) + 27.38 x (39.2 – 27.9) = • = 6255 + 1102 = 7357 (LVL) • Quality adjusted price change: 7357 / 8625 x 100 = 85.3 or -14.7%
Computers in Latvian HICP • Information processing equipment in the HICP basket since 1999 • in 1999 two items, in 2011 seven items in the HICP basket • weights (in graph)
Computers in Latvian HICP (2) • Most important items: desktop computers and notebooks
Computers in Latvian HICP (3) • Quality adjustment methods proposed by CENEX research: • bridged overlap for notebooks and • option pricing for desktops. • Alternative approach: development of the hedonic model and applying hedonic re-pricing model both for desktops and notebooks. • If replaced and replacement models essentially equivalent: direct comparison.
Desktops • Option pricing or hedonic • Latvian approach – option pricing (in general: follow the CENEX recommendations) • Recommended characteristics for observation: • Processor type (e.g. Celeron, Pentium IV, . . .). • Processor speed (in MHz). • Hard disk capacity (in GB). • Working memory (in MB/GB). • Operating system (Windows XP, Linux, none, . . .). • Other software (MS Office, . . .). • Type of monitor, including size (TFT or not, . . .). • Type of drive (CD-rewriter, DVD player/rewriter, . . .).
Desktops (2) • Adjustment procedure: • Observed price of the replacement • + • Option prices of the characteristics in which the replaced model differs from the replacement • – • Option prices of these characteristics of the replacement • = • Quality adjusted price of the replacement
Desktops (3) • Example • old (replaced) model 400 LVL • new (replacement) model 450 LVL • both desktops essentially equivalent except for their hard disk. The old model had 100 GB capacity, while new model 200 GB. When bought separately in the current month, a 200 GB hard disk would cost 100 LVL, whereas a 100 GB hard disk would cost 40 LVL • adjusted price for replacement model : 450 + 40 - 100 = 390 LVL • Price change, adjusted for quality change: 390 / 400 = -2,5%
Desktops (4) • Latvian approach • the same idea, whereas different mathematical interpretation • calculate the share of price difference between old and new model, which is attributed to quality change (100 – 40) / (450 – 400) = 120% • adjusted price for replaced (old) model: (450 * 400)/(450 - ((450 - 400) * 120 / 100)) = 461,5 LVL • Price change, adjusted for quality change: 450 / 461,5 = -2,5% • Price changes without quality adjustment: 450 / 400 = 12,5%
Notebooks • One of recommended methods: Bridged overlap • A bridge is needed to reflect and apply the price change of all unchanged (matched) notebooks to the new model.
Notebooks (2) • Example