Download
1 / 30
300 likes | 435 Views
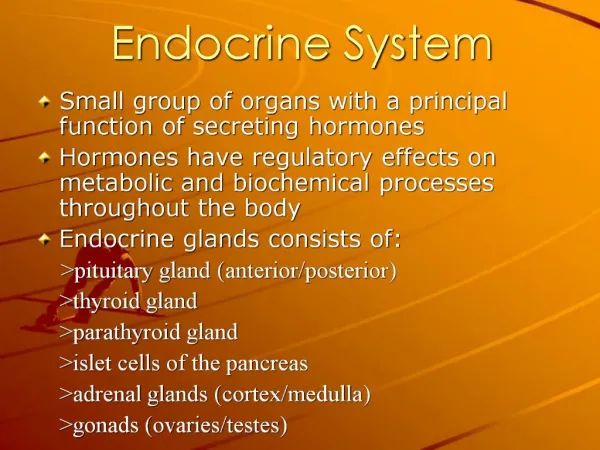
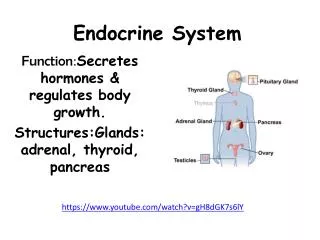
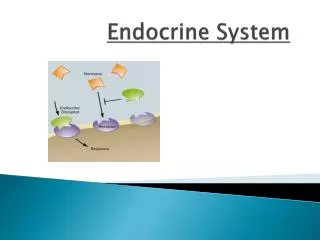
Endocrine System. Blood vessel. Response. (a) Endocrine signaling. Figure 45.2a. Response. (b) Paracrine signaling. Response. (c) Autocrine signaling. Synapse. Neuron. Figure 45.2b. Response. (d) Synaptic signaling. Neurosecretory cell. Blood vessel. Response.

E N D
Bloodvessel Response (a) Endocrine signaling Figure 45.2a Response (b) Paracrine signaling Response (c) Autocrine signaling
Synapse Neuron Figure 45.2b Response (d) Synaptic signaling Neurosecretorycell Bloodvessel Response (e) Neuroendocrine signaling
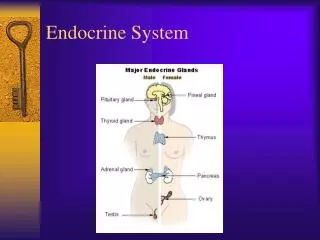
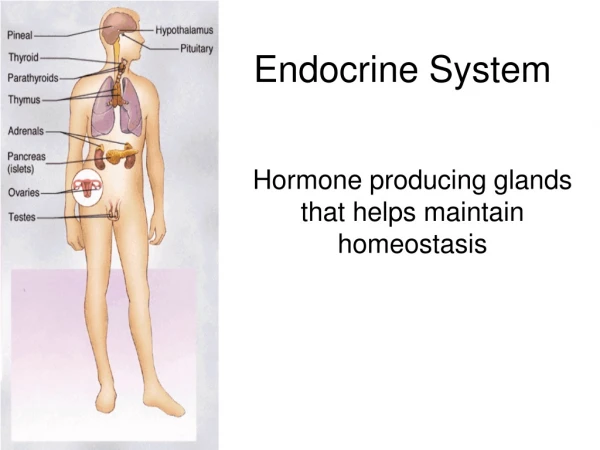
Major endocrine glands: Hypothalamus Pineal gland Pituitary gland Organs containingendocrine cells: Thyroid gland Thymus Figure 45.4 Parathyroid glands(behind thyroid) Heart Liver Adrenal glands(atop kidneys) Stomach Kidneys Pancreas Smallintestine Ovaries (female) Testes (male)
Cerebrum Pinealgland Thalamus Hypothalamus Cerebellum Pituitarygland Spinal cord Figure 45.14 Hypothalamus Posteriorpituitary Anteriorpituitary
Water-soluble (hydrophilic) Lipid-soluble (hydrophobic) Polypeptides Steroids Figure 45.5 0.8 nm Insulin Cortisol Amines Epinephrine Thyroxine
SECRETORYCELL Lipid-solublehormone Water-solublehormone Figure 45.6-2 VIABLOOD Transportprotein Signal receptor TARGETCELL OR Signalreceptor Cytoplasmicresponse Generegulation Cytoplasmicresponse Generegulation NUCLEUS (a) (b)
Epinephrine Adenylylcyclase G protein Figure 45.7-2 GTP G protein-coupledreceptor ATP Secondmessenger cAMP Proteinkinase A Inhibition ofglycogen synthesis Promotion ofglycogen breakdown
EXTRACELLULARFLUID Hormone(estradiol) Estradiol(estrogen)receptor Plasmamembrane Figure 45.8-2 Hormone-receptorcomplex NUCLEUS CYTOPLASM DNA Vitellogenin mRNAfor vitellogenin
(b) Skeletal muscleblood vessel (c) Intestinal bloodvessel Same receptors but differentintracellular proteins (not shown) Different receptors Figure 45.9 Different cellularresponses Different cellularresponses Epinephrine Epinephrine Epinephrine receptor receptor receptor Glycogendeposits Vesseldilates. Vesselconstricts. Glycogenbreaks downand glucoseis releasedfrom cell. (a) Liver cell
Example Pathway Low pH in duodenum Stimulus S cells of duodenumsecrete the hormonesecretin ( ). Figure 45.11 Endocrinecell Hormone Negative feedback Bloodvessel Targetcells Pancreas Response Bicarbonate release
Example Pathway Stimulus Suckling Sensoryneuron Hypothalamus/posterior pituitary Figure 45.12 Posterior pituitarysecretes theneurohormoneoxytocin ( ). Neurosecretory cell Neurohormone Positive feedback Blood vessel Targetcells Smooth muscle inbreasts Response Milk release
Cerebrum Pinealgland Thalamus Hypothalamus Cerebellum Pituitarygland Spinal cord Figure 45.14 Hypothalamus Posteriorpituitary Anteriorpituitary
Tropic effects only:FSHLHTSHACTH Neurosecretorycells of thehypothalamus Nontropic effects only:ProlactinMSH Figure 45.16 Nontropic and tropic effects:GH Hypothalamicreleasing andinhibitinghormones Portal vessels Endocrine cellsof the anteriorpituitary Posteriorpituitary Pituitaryhormones Prolactin FSH and LH MSH ACTH GH HORMONE TSH TARGET Melanocytes Mammaryglands Liver, bones,other tissues Thyroid Adrenalcortex Testes orovaries
Hypothalamus Neurosecretorycells of thehypothalamus Figure 45.15 Neurohormone Axons Posteriorpituitary Anteriorpituitary HORMONE ADH Oxytocin Mammary glands,uterine muscles Kidneytubules TARGET
Example Pathway Stimulus Cold Figure 45.17 Sensory neuron Hypothalamus secretesthyrotropin-releasinghormone (TRH ). Hypothalamus Neurosecretory cell Releasing hormone Blood vessel Anterior pituitary secretesthyroid-stimulatinghormone (TSH, also knownas thyrotropin ). Anterior pituitary Tropic hormone Negative feedback Thyroid gland secretesthyroid hormone(T3 and T4 ). Endocrine cell Hormone Targetcells Body tissues Increased cellularmetabolism Response
Activevitamin D Increases Ca2uptake inintestines Stimulates Ca2uptake in kidneys PTH Figure 45.20-2 Parathyroidgland (behindthyroid) Stimulates Ca2 releasefrom bones STIMULUS:Falling bloodCa2 level Blood Ca2level rises. Homeostasis:Blood Ca2 level(about 10 mg/100 mL)
(a) Short-term stress response and the adrenal medulla Figure 45.21a Stress Nervesignals Spinal cord(cross section) Hypo-thalamus Nervecell Nerve cell Adrenal medullasecretes epinephrineand norepinephrine. Effects of epinephrine and norepinephrine: Adrenalgland • Glycogen broken down to glucose;increased blood glucose Kidney • Increased blood pressure • Increased breathing rate • Increased metabolic rate • Change in blood flow patterns, leading toincreased alertness and decreased digestive,excretory, and reproductive system activity
Figure 45.21b (b) Long-term stress response and the adrenal cortex Stress Hypothalamus Releasinghormone Anterior pituitary Blood vessel Effects of glucocorticoids: ACTH Effects of mineralocorticoids: • Proteins and fats broken down and converted to glucose, leading to increased blood glucose • Retention of sodium ions and water by kidneys Adrenalgland Adrenal cortexsecretes mineralo-corticoids andglucocorticoids. • Increased blood volume and blood pressure • Partial suppression of immune system Kidney
Insulin Body cellstake up moreglucose. Beta cells ofpancreasrelease insulininto the blood. Liver takesup glucose and stores itas glycogen. STIMULUS:Blood glucose level rises (for instance, after eating acarbohydrate-rich meal). Figure 45.13 Blood glucoselevel declines. Homeostasis:Blood glucose level(70–110 mg/m100mL) STIMULUS:Blood glucose level falls (for instance, afterskipping a meal). Blood glucoselevel rises. Liver breaksdown glycogenand releasesglucose intothe blood. Alpha cells of pancreasrelease glucagon intothe blood. Glucagon