Download
1 / 20
200 likes | 280 Views
Graphics with r A statistical tool for high school maths. By: Jade Write, Garth Lo Bello, Andrew Roberts, Prue Tinsey and Tania Young. Why Should We Use R?. Using R, students have access to open source, professional quality, software

E N D
Graphics with rA statistical tool for high school maths By: Jade Write, Garth Lo Bello, Andrew Roberts, Prue Tinsey and Tania Young
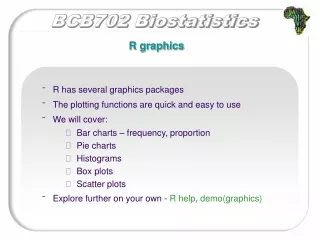
Why Should We Use R? • Using R, students have access to open source, professional quality, software • Unlike Excel, this program requires knowledge of computing language • Simple code can be provided by a teacher for the students to use with their • own data. • Not having “built in functions,” students have the chance to see more of what is involved in statistical procedures. • R can perform all the tasks Excel can, but provided many more enhanced abilities, is free and is also used by professional statisticians.
THE TASK • Students will be asked to collect data from the classroom • Examples could include hours spent studying vs. Other activities, • their height, the time it takes them to complete homework, etc. • Then the students will run R using code given by their teacher and • produce relevant graphical displays for interpreting their findings. Teachers who are not comfortable using R, can get their students to complete these activities in excel and still gain the same results
Example 1: Hours spent on various activities Suppose a student spends: 5 hours at school 3 hours with friends 1 hour doing homework 2 hours working at a job 1 hour travelling 8hours sleeping 4 hours watching TV
R - code x <- c(5, 3, 1, 2, 1,8,4) pie(x, main="Hours of Student Life", col=rainbow(length(x)), labels=c("School","Friends","Homework", "Job", "Travel", "Sleep", "TV")) pie(x, main="Hours of Student Life", col=rainbow(length(x)), labels <- round(x/sum(x) * 100, 1)) x_labels <- paste(labels, "%", sep="") pie(x, main="Daily Hours as Percent of Day", col=rainbow(length(x)), labels=x_labels,) legend("bottomleft", c("School","Friends","Homework","Job","Travel","Sleep", "TV"), cex=0.9,bty="n",fill=rainbow(length(x)))
The student is asked to produce a pie chart with legend to represent their daily lifestyle.
Now let’s look at the normal distribution Suppose students compile data regarding the amount of time per Day they spend on homework in minutes. Ex: 20, 25,....120 And the teacher asks the student to use R to represent this data in A histogram that shows the mean. R can do this rather simply
A normal curve fitted To a sample of 100 With R, simply change one number and students can see how sample size affects the shape
What if you have student’s measure their own heights and want them to analyse that? You could have them first collect the heights of all The students in the class..... Then compare the results when the separate the heights of boys From girls This could spark a discussion about how certain displays Can be more illustrative than others And why, in statistics, knowing your target population has great importance.
RESULTS ALL STUDENTS: Min. 1st Qu. Median Mean 3rd Qu. Max. 153.0 155.0 161.5 161.0 166.0 170.0 BOYS Min. 1st Qu. Median Mean 3rd Qu. Max. 163.0 165.8 166.0 166.4 167.2 170.0 GIRLS Min. 1st Qu. Median Mean 3rd Qu. Max. 153.0 154.0 155.0 155.5 156.2 160.0
Example in Excel This links to a video that demonstrates this activity step by step in excel http://www.youtube.com/watch?v=UASCe-3Y1to
CONFUSED OR WORRIED ABOUT USING A PROGRAM THAT REQUIREs CODE? There are thousands of free examples online
SUMMARY R is a free program that not only does everything excel does but also provides the ability for the student to see the steps involved by avoiding built in functions. This enhances learning and allows for creativity while at the same time providing students the chance to learn a piece of Software statisticians ACTUALLY use Writing code can be daunting at first, but a simple Google search provides numerous scripts that can be amended to fit any task The R website also provides free help and downloads at: http://www.r-project.org/