Download
1 / 41
410 likes | 413 Views
Evaluation of the First Annual San Diego Science Festival (SDSF). Karen Peterman, Ph.D. Marianne McPherson, M.A. June 2009. This report presents results collected throughout the month-long SDSF to describe:. The students and general public who participated in Festival events

E N D
Evaluation of the First Annual San Diego Science Festival (SDSF) Karen Peterman, Ph.D. Marianne McPherson, M.A. June 2009
This report presents results collected throughout the month-long SDSF to describe: • The students and general public who participated in Festival events • Ways that the SDSF influenced attendees’ interest in and awareness of science
The SDSF evaluation focused on five types of events: • Nifty Fifty • Science on the Mesa • Festival Programs • Small Wonders • Expo Day at Balboa Park
In addition, 924 people volunteered their time to host SDSF events.
Science on the Mesa and Beyond (SMB) • Science organizations from around the county opened their doors to students • 2.5 hour events included hands-on activities and exposed students to the science being conducted in San Diego
SMB involved: • 24 companies, organizations, and institutions • 220 volunteers (scientists, staff, etc.) • 1,024 students • 51 teachers
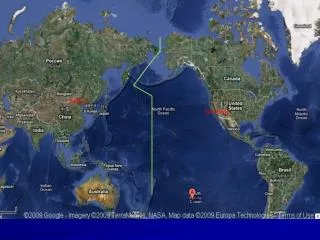
SOM was hosted by companies in a concentrated area, and attended by students from across the county. Map created in Google maps.
Students are unaware of the science going on in the county. • Before coming to SMB: • Only 35% of students had ever heard of the company/organization that hosed their event. • An even smaller number (29%) knew what kind of work the organization did. N=1,024
SMB was quite effective at exposing students to local organizations and the science they conduct. N=1,024
Over half of the SOM students rated the event as very or extremely successful at influencing them in key ways. N=1,024; very and extremely were the top points on the 5-point scale.
SOMs were effective at helping students feel more connected with the science community. N=1,024
The Nifty Fifty • Science role models presented to middle- and high-school students at their schools • Presentations focused on accomplishments and careers paths
Nifty Fifties involved: • 85 scientists • 98 schools • 14,965 students • 449 teachers
Nifty Fifty schools were from across the county; half were from schools south of the city. Map created in Google maps.
Just under half of all Nifty Fifty students identified as Hispanic.
About half of the Nifty Fifty students rated the event as very or extremely successful at influencing them in key ways. N=8,086; very and extremely were the top points on the 5-point scale.
A majority of students felt more connected to the science community after participating in Nifty Fifties. N=7,884
Science Festival Expo (Expo) • A day-long event at Balboa Park that included hands-on science activities and several performances • 203 exhibit booths
The Expo involved: • 203 companies, organizations, and institutions • 180 volunteers • At least 30 schools • 50,000 attendees
Schools from across the county hosted booths at the Expo. Map created in Google maps.
Additional schools bussed students in for the event. Map created in Google maps.
The majority of Expo survey participants identified as White. N=762
Expo survey participants were from a variety of age groups. N=762
Over half of the Expo survey participants rated the event as very or extremely successful at influencing them in key ways. N=762; very and extremely were the top points on the 5-point scale.
Attendees felt more connected to the science community after participating in the Expo. N=762
Participants • Thousands of people attended the first annual SDSF. • The majority of students who participated were Hispanic. • Most participants who attended events for the general public were White. • The SDSF also provided the opportunity for hundreds of scientists and volunteers to engage the public in science.
Feedback • Participants provided positive feedback about their SDSF experiences.
Outcomes and Impact • SOMs were quite effective at helping students learn about science opportunities in San Diego county. • The majority of participants considered the SDSF very or extremely successful at meeting its goals.
Outcomes and Impact, cont. • Of its learning goals, the SDSF was most successful at: • Providing examples of the science around attendees every day, and • Inspiring attendees to learn more about science. • In most cases, at least half of the student participants also indicated that the SDSF improved their opinion of science and their interest in science careers.
Acknowledgements • The SDSF team collected and entered the survey data. • Photos in this report were downloaded from the SDSF Web site. • The Google maps in this report were created by students from The Preuss School.