Download
1 / 6
60 likes | 196 Views
Nipponbare. O . rufipogon. Grandiglumis. Caloro. HP2216. O. nivara. Tetep. O. rhizomatis. Bhrigudhan. K-60. Co-39. O . minuta. O. punctata. Jatto. O. latifolia. O . officinalis. 1bp. 500. 1000. 2000bp. 1500.

E N D
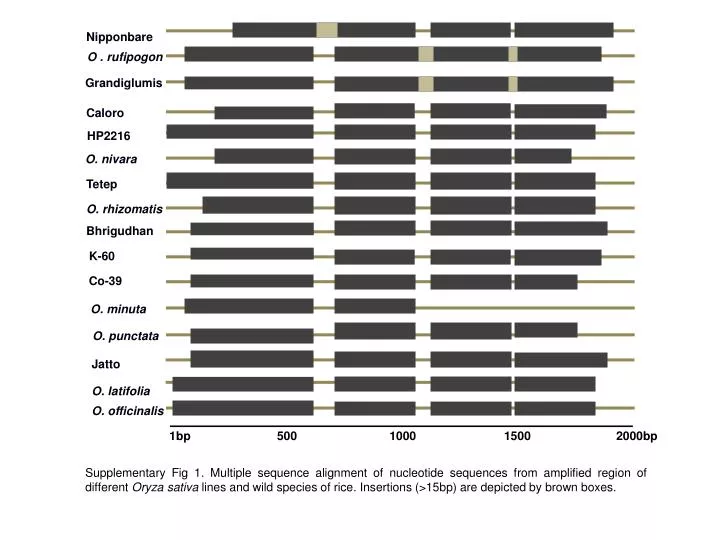
Nipponbare O . rufipogon Grandiglumis Caloro HP2216 O. nivara Tetep O. rhizomatis Bhrigudhan K-60 Co-39 O. minuta O. punctata Jatto O. latifolia O. officinalis 1bp 500 1000 2000bp 1500 Supplementary Fig 1. Multiple sequence alignment of nucleotide sequences from amplified region of different Oryza sativa lines and wild species of rice. Insertions (>15bp) are depicted by brown boxes.
Supplementary Fig. 2. Aligned amino acid sequences of LRR regions from Pi54 allele isolated from different rice lines and species.
Supplementary Fig. 3. Different domains reported in Pi54 alleles and their relation with rice blast resistance. A: resistant allele, B: susceptible allele
Supplementary Fig. 4. Dendrogram obtained using DNA sequences from the predicted ORF regions of different Pi-54 alleles. The analysis was performed with CLUSTALX software. Bootstrap (1000 replications) values are given on the nodes. Branch length represents the various nucleotide substitutions.
Supplementary Fig. 5. Dendrogram obtained using protein sequences from the predicted ORF regions of different Pi-54 alleles. The analysis was performed with CLUSTALX software. Bootstrap (1000 replications) values are given on the nodes. Branch length represents the various nucleotide substitutions.
Supplementary Fig 6. Dendrogram obtained using protein sequences from the NBS regions of different Pi-54 alleles. The analysis was performed with MEGA 5.0 software. Bootstrap (1000 replications) values are given on the nodes. Branch length represents the various nucleotide substitutions.