Download

1 / 38
380 likes | 549 Views
Accessibility. David Levinson. Why Do Cities Form?. Why does the Twin Cities exist? Why are the Twin Cities larger than Duluth or Fargo? Why is Chicago more important than St. Louis? What is inevitable, what is chance?. Accessibility.

E N D
Accessibility David Levinson
Why Do Cities Form? • Why does the Twin Cities exist? • Why are the Twin Cities larger than Duluth or Fargo? • Why is Chicago more important than St. Louis? • What is inevitable, what is chance?
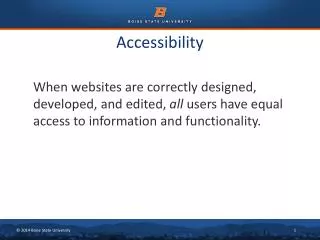
Accessibility • A measure that relates the transportation network to the pattern of activities that comprise land use. • It measures the ease of reaching valued destinations. • Accessibility “is perhaps the most important concept in defining and explaining regional form and function.” (Wachs and Kumagai 1973)
The Power of Networks • Top picture: two “markets”: A-B and B-A. • Middle Picture: six markets: B-C, C-B, C-A, A-C • Bottom Picture: twelve markets: D-C, C-D, D-B, B-D, D-A, A-D
S = N ( N-1) S = Size of the Network: N = Number of Nodes (places) To illustrate With 2 nodes: S = 2*1 = 2 With 3 nodes: S = 3*2 = 6 With 4 nodes: S = 4*3 =12. And so on. Mathematical Expression
Relative vs. Absolute Change • Do people value the absolute increase (each person I am connected to adds the same value)? • Or do people value the relative change (I will pay twice as much for a network that is twice the size)?
Where: Pj= some measure of activity at point j (for example jobs) Cij= the cost to travel between i and j (for example travel time by auto). Measuring Point Accessibility
where: A = Accessibility Wi = Workers at origin i Ej = Employment at destination j f(Cij) = function of the travel cost (time and money) between i and j. Measuring Metropolitan Accessibility
Network Size: All nodes valued equally Independent of type of node Independent of spatial separation of nodes Accessibilty: Places are not equal Places (i, j) are weighted according to size Considers spatial separation of places. Network Size vs. Accessibility
Absolute vs. Relative Accessibility • A transportation improvement reduces the travel time between two places. What happens? • The absolute accessibility of the entire region increases. The pie increases • The relative accessibility of the two places increases at a greater rate than the rest of the region. The slice of the pie going to those two places increases even more. • Why does this matter?
Feedback: Positive and Negative Positive Feedback Systems • More begets more • Less begets less. • Examples? Negative Feedback Systems • More begets less • Less begets more. • Examples?
Constraints • If the model is correct, why don’t we live on coruscant? • Time - we just don’t live there yet • We do, visit New York, Tokyo, Hong Kong • Congestion and related costs to density limit the accessibility machine • Population, food, energy are constraints
Gravity Model • Hypothesis: The interaction between two places decreases with distance, but increases with the size of the two places. • There is more interaction between Minneapolis and St. Paul than Minneapolis and Chicago, despite the fact that Chicago is bigger. • Similarly there is more interaction between Minneapolis and Chicago than Minneapolis and Los Angeles. • However, there is more interaction between Minneapolis and Los Angeles than Minneapolis and Las Vegas, despite the fact that Las Vegas is closer.
Tij = KiKj Oi Dj f(Cij) Where Tij = Trips from i to j Oi = Productions of trips at origin i Dj = Productions of trips at destination j Ki, Kj = balancing factors solved iteratively Gravity Math
f(Cij) • For auto: • For transit: Where: • Cija = peak hour auto travel time between zones i and j; and • Cijt = peak hour transit travel time between zones i and j.
Testing the Gravity Model • It is hypothesized that living in an area with relatively high jobs accessibility is associated with shorter trips, as is working in an area of relatively high housing accessibility. • (the doubly-constrained gravity model)
Data • MWCOG Household Travel Survey (1987-88) • 8,000 households and 55,000 trips • Accessibility Measures
Jobs and Housing Accessibility and Commuting Duration In the gravity model implicitly being tested here, average commute to work time is determined by three factors: 1) a propensity (choices) function which relates willingness to travel with travel cost or time, (individual demand) 2) the opportunities (chances) available at any given distance or time from the origin, (market “supply”) and 3) the number of competing workers. (market demand) Propensity = f ( tij , Income, Mode, Gender... ) It is hypothesized that this underlying preference is relatively undifferentiated based solely on location.
Geographic Factors 1) distance between the home and the center of the region (Di0) (the zero mile marker at the ellipse in front of the White House), 2) distance between workplace and the center (Dj0), 3) accessibility to jobs from the home (AiE), 4) accessibility to other houses from the home (AiR), 5) accessibility to other jobs from the workplace (AjE), 6) and accessibility to houses from workplace (AjR).
Chart 1: Summary Hypotheses Trip-End Home-End Work-End (Origin) (Destination) ------------------------------------------------------------ Accessibility AiE AjE to Jobs negative positive Accessibility AiR AjR to Houses positive negative Distance Di0 Dj0 from Center positive negative
Accessibility and Housing Value Urban Economics suggests trade-off time & money - finding supported for auto accessibility - not for transit accessibility
Conclusions • The City is the Network. • Location matters, important explanatory variable, but • Density and J/H Balance (Accessibility) weak policy variables to influence commuting. ... • Ignores self-selection process - creating more high density housing won’t create more young or old who wish to live in those high density urban areas.