Download
1 / 17
190 likes | 569 Views
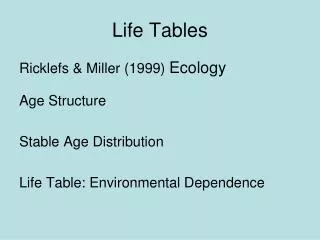
Life tables. Were first used to estimate insurance risk in human populations Divides the population into age specific classes Estimates the age-specific mortality risk in each class. A life table for a town in the East Midlands. Assembling a life table. Cohort or Dynamic life table

E N D
Life tables • Were first used to estimate insurance risk in human populations • Divides the population into age specific classes • Estimates the age-specific mortality risk in each class
Assembling a life table • Cohort or Dynamic life table • Assembled by following the fate of a cohort from birth to death. • Static life table • Assembled estimating the age specific death risks from the age structure at a given time
Dynamic life table Static life table
However a static life table assumes the population is stable which is usually not true Original estimates But what if the population is decreasing? Decreasing population
Phlox drummondii (annual phlox) is native to central and eastern Texas. It is a winter annual and grows abundantly in sandy fields and on roadside verges. It germinates in response to cool rainy weather.
qx=lx-lx+1 the proportion of individuals that have died over a time period = the mortality rate.
Mortality analysis Average mortality rate per day time days Average mortality rate per day Log scale time days
Fecundity analysis Number of seed produced per plant time days
Diagrammatic dynamic life table for Phlox drummondii Rectangles=stages in the life-cycle Inverted triangles= transition probabilities Diamond=seed production
A more complex diagrammatic life table of the biennial ragwort Senecio jacobea Dispersal Seed bank dynamics germination immigration Biennial lives for 2 years reproducing at the end of the second year establishment
Survivorship curves Type I = Found where there are ample resources e.g. human population in developed countries Type II = A constant risk of death throughout lifespan e.g. seeds in a buried seedbank Type III = High early mortality e.g. many plants reproducing by seed
Survivorship curves of Erophila verna at different densities a=1-2 b=5-10 c=15-20 d=35-50 e=>50 1000s m-2 Survivorship curves for a species depend on a range of conditions
In plants stage of development can be a more useful definition of progress than age. Data are for a perennial Ranunculus acris juveniles immature vegetative generative dead