Download
1 / 14
140 likes | 288 Views
Chlorophyll a in the lower Cape Fear River System 2009. Chris Holland Chemistry 576. Importance of Chlorophyll a. Necessary for photosynthesis Proxy for measuring biomass of phytoplankton Along with other pigment can be used for taxonomic identification Gives plants green color.

E N D
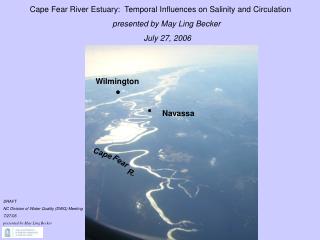
Chlorophyll a in the lower Cape Fear River System 2009 Chris Holland Chemistry 576
Importance of Chlorophyll a • Necessary for photosynthesis • Proxy for measuring biomass of phytoplankton • Along with other pigment can be used for taxonomic identification • Gives plants green color
Structure of Chlorophyll a • Porphyrin polar ring responsible for absorbing light (400nm to 700nm PAR) • Non polar end (Phytol) used to anchor to the membrane • Phyophytins degrade in the presence of light
Methods of Measuring Chla • Water samples were collected at each station at surface and deep • 300mL was filtered at each station and frozen until analysis to prevent degradation of pigments • Extract with 90% acetone • Read on Fluorometer (Turner 10AU) and ug/L was calculated for each station
Surface and deep chla concentrations from Cruise 1 and 2 Chla was higher in the deep for the majority of the stations on both cruises, which is not normal due the fact that production in the CFRE is light limited Unusual high chla at Horseshoe Bend where light penetration is the least Cruise 2 had higher chla in the deep samples
2008 had chla concentrations that were abnormally high due to prolonged drought conditions. The chla numbers measured in September were on the order of 3 to 5 times higher than the rest of the years. When 2008 data is taken out, numbers are still higher in September but only at the mid estuary stations. October average concentrations were similar to those found this year.
Chla concentrations vs. ysi surface salinity Cruise 1 is not correlated at all with respect to salinity and chla concentration. Cruise 2 shows a more normal pattern with increasing chla with increasing salinities Higher chla numbers with increasing salinities are likely due to more light that is available with clearer waters associated with the higher salinities
Chla vs. salinity deep Higher chla numbers with increasing salinities are likely due to more light that is available with clearer waters associated with the higher salinities Cruise 2 chla numbers are again more related to salinity changes as in the surface data. Cruise 1 seems to be well mixed and not correlated with salinity.
Kd- light attenuation Higher Kd=lower light penetration therefore lower chla numbers are to be expected Chla concentrations from Cruise 1 seem to not be correlated Cruise 2 chla more linearly correlated with Kd, chla decreased as we traveled into darker waters near HB Higher chla numbers were at stations with lower Kd values
Conclusions • 2008 September averages much higher than normal due to drought conditions • These conditions would have pushed higher salinity water and therefore clearer water further down the river • Primary production increased with less light limitation
Conclusions cont. • October averages from 2004 to 2008 more similar to Cruise 2 this year • Trend of lower chl a towards Horseshoe Bend due to more light limitation and lower salinities • Cruise 1 salinity vs. chla not statistically significant but Cruise 2 is (r²=0.9185)
Conclusions cont. • Kd values vs. chl a concentrations show that in Cruise 1 the chl a values were similar at each station, no real change on the transect • Cruise 2 showed more of a pattern of decreasing chl a toward HB due to less light penetration