Download
1 / 16
160 likes | 247 Views
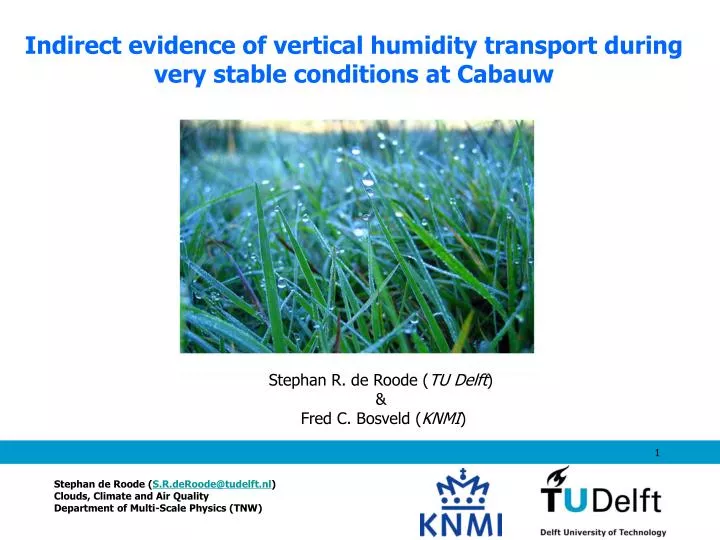
Indirect evidence of vertical humidity transport during very stable conditions at Cabauw. Stephan R. de Roode ( TU Delft ) & Fred C. Bosveld ( KNMI ). Stephan de Roode ( S.R.deRoode@tudelft.nl ) Clouds, Climate and Air Quality Department of Multi-Scale Physics (TNW).

E N D
Indirect evidence of vertical humidity transport during very stable conditions at Cabauw Stephan R. de Roode (TU Delft) & Fred C. Bosveld (KNMI) Stephan de Roode (S.R.deRoode@tudelft.nl) Clouds, Climate and Air Quality Department of Multi-Scale Physics (TNW)
Stable boundary layers -Analysis of Cabauw data for the period 2001-2006
Monthly mean surface energy balance during stable conditions
Monthly mean surface energy balance during stable conditions
Dew formation downward vertical humidity transport • Problems • - eddy correlation humidity flux at 5 m is negligibly small • - large residual in surface energy balance • Relevance • - Testing schemes (TKE, EDMF, etc) against observations • - Site used for GABLS3 case • - Humidity important for fog formation • Question • - Are the measured latent heat fluxes in accord with observed humidity tendencies from Cabauw tower?
Example: humidity tendencies from Cabauw tower qsat,sfc 80 m 2m 10m
Mean humidity tendencies (all selected SBLs) Significant mean tendencies near the surface
Mean humidity tendencies at 2m as a function of wind direction Negative humidity tendency for any prevailing mean wind direction
Tendencies of the mean humidity at 2m and the surface saturation specific humidity Surface cooling causes downgradient humidity flux
Mean humidity tendencies as a function of the bulk Richardson number Tendencies even for very stable conditions
Ditches are another local source of moisture Courtesy Adriaan Schuitmaker Courtesy Kees Floor
Dispersion of a passive scalar in a stable boundary layer at Cabauw Field experiment (measuring vertical velocities with laser technique) by Petra Kroon, Harm Jonker, Adriaan Schuitmaker and others (TU Delft)
Sources dew formation 1. Vertical turbulent transport from atmospheric column 2. Condensation of moisture evaporated from ditches
Dew research in Wageningen (Jacobs et al.) Wageningen dew fall corresponds to a mean latent heat flux of about 10 Wm-2
Conclusions 1. Surface energy imbalance partly due to "missing" latent heat flux - instrument wetting - measurement height 5 m - small turbulent fluctuations 2. Dew fall from - atmospheric column - evaporated moisture from numerous ditches 3. We expect similar dew fall as in Wageningen (about 50 km from Cabauw) - latent heat flux LE≈-10Wm-2 (Jacobs et al. 2006)
Monthly mean humidity tendencies (g/kg/hr) corresponding flux