Download
1 / 16
160 likes | 245 Views
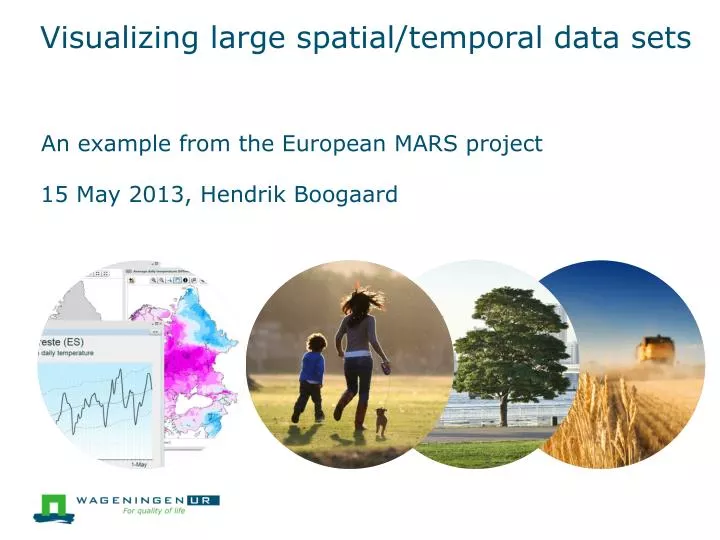
Visualizing large spatial/temporal data sets. An example from the European MARS project. 15 May 2013, Hendrik Boogaard. MARS project – I ntroduction. Monitoring Agricultural ReSources (MARS) Started early nineties, operational since 2000 Main objectives:

E N D
Visualizing large spatial/temporal data sets An example from the European MARS project 15 May 2013, Hendrik Boogaard
MARS project – Introduction • Monitoring Agricultural ReSources (MARS) • Started early nineties, operational since 2000 • Main objectives: • Monitoring weather and crop conditions of current growing season (early warning, extreme events) • Forecast crop yield in objective and timely manner • In support of: • European Common Agricultural Policy on commodities & subsidies (focus on Europe, Asia) • Food aid (focus on Africa)
MARS project – Introduction • Operational services outsourced: • Provision weather data (stations, models) • Running and maintenance of agro-meteorological models for Europe, Russia and Asia (CGMS) and global crop specific soil water balances • Provision of satellite based vegetation indices and rainfall estimates • Development and maintenance of MARS-viewers
MARS project – List of operational services weather monitoring based on interpolated station data pan-Europe weather monitoring based on ECMWF deterministic forecast pan-Europe and Asia weather monitoring based on ECMWF ensemble models pan-Europe crop monitoring based on interpolated station data pan-Europe crop monitoring based on ECMWF deterministic forecast pan-Europe and Asia crop monitoring based on ECMWF ensemble models pan-Europe crop yield forecast based on interpolated station data pan-Europe crop yield forecast based on ECMWF deterministic forecast pan-Europe and Asia crop yield forecast based on ECMWF ensemble models pan-Europe weather monitoring based on ECMWF deterministic forecast global crop specific drought monitoring global vegetation indices based on SPOT-VEGETATION sensor global vegetation indices based on NOAA-AVHRR sensor global vegetation indices based on METOP-AVHRR sensor pan-Europe vegetation indices based on MODIS-250m sensor pan-Europe and Horn of Africa weather and vegetation indices based on MSG-SEVIRI pan-Europe rainfall estimates based on MSG and observed rainfall Africa
MARS project – Variety of data sets • Large number of themes • Different Regions Of Interest (ROIs) • Different spatial resolutions • grids, administrative regions, agro-ecological zones • Different time resolutions: day, 10-day, month, year • 9 TB of data stored in relational database (ORACLE)
Viewers – Rich & flexible • Serving: • Analysts of European commission (bulletin mode) • Public e.g. universities (limited in data/features) • Online viewer to perform spatial and temporal analysis of data sets in a customized way: • Large number data sets & indicators • Flexible period definition (on-the-fly) • Flexible region definition • Analysis types: current season, anomalies, way of aggregation, similarity analysis (time series)
Viewers – Key functionality • Geo-linked multiple map windows • Geo-linked graphs • Spatial layers supporting labelling, masking • Legend management • Export of data and formatted maps/graphs (PDF, PNG) • Favourite management (save current viewer windows configuration for later re-use) • Configuration of all chart layout settings • Pre-configured graph templates for analysts
Viewers – Architecture & components • Client-server architecture, different components: • Client application (runs in Adobe Flash Player) • RIA developed in Adobe Flex • Application Server & WMS Server • Model Data Servers (or other apps) • Databases (data and GUI-settings)
Viewers – Application server & WMS Server • XML Communication between client and server • Java servlets handle all requests to secured system parts • Security check ensured at one place • Geoserver (open source) • Shape files on local hard disk of the server perform better than spatial data in the Oracle database
Viewers – GUI • User interface driven by configuration settings in DB • New data / indicators / functions can be added on the fly • User interface automatically changes without coding
Viewers – Model Data Servers • Respond to a request (URL) by returning data as either XML (polygon or point request) or XML + .png file (grid request) • Deliver faster thanOracle queries (through file andin-memory caching)
Thanks for your attention! www.marsop.info (get access after registration)


![Five Parts to this Chapter Temporal Acuity (critical flicker frequency [CFF])](https://cdn1.slideserve.com/3122999/slide1-dt.jpg)