Download
1 / 5
60 likes | 190 Views
Evolution of Myocardial Blush after MI. 2.8%. Mean of 7.5 months. Hoffman et al, AJC 2003; 92: 1015-19. Associaiton of Myocardial Blush with LV Function at 4 Weeks. Lepper et al AJC 2001; 88:1358-1363. Evolution of Myocardial Blush after MI. 2.8%. Mean follow-up 7.5 months.

E N D
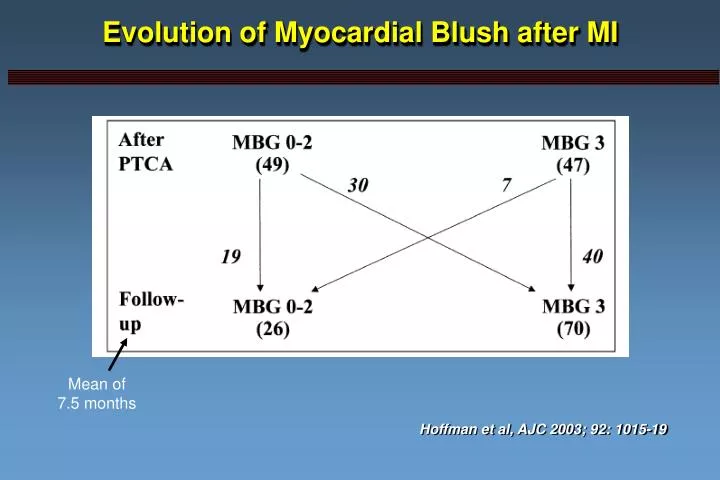
Evolution of Myocardial Blush after MI 2.8% Mean of 7.5 months Hoffman et al, AJC 2003; 92: 1015-19
Associaiton of Myocardial Blush with LV Function at 4 Weeks Lepper et al AJC 2001; 88:1358-1363.
Evolution of Myocardial Blush after MI 2.8% Mean follow-up 7.5 months Hoffman et al, AJC 2003; 92: 1015-19
Left Ventricular Function in Relation to Evolution of Myocardial Blush 2.8% LVEF at mean 7.5 months Mean follow-up 7.5 months Hoffman et al, AJC 2003; 92: 1015-19
Evolution of Thrombolysis in Myocardial Infarction Myocardial Perfusion Grade During Primary Coronary Angioplasty in Acute Myocardial Infarction Predicts Long-Term Recovery of Left Ventricular Function Conclusion: Maintaining a high MPG throughout PCI in AMI or achieving a marked MPG improvement are both related to improved ST resolution, smaller areas under the curve for myonecrosis, and better ejection fractions acutely and at 6 month follow-up. *p<0.01 vs. I, **p<0.01 vs. II, †p<0.001 among I-VI, ††p<0.001 vs. I-IV, ***p<0.01 vs. EF-24h AUC: Area under curve of CK-MB release in the first 48 hours V – MPG improvement from 0/1 to 3, VI – High MPG maintained (2/3 before and 3 after PCI) Jaroslaw Zalewski et al, ACC 2004