Download
1 / 21
210 likes | 338 Views
Lecture 5 FOR Looping. Summation Symbolic differentiation Counting ATCG. Summation. x = 1.5. x = 1.5. floor(x). ceil(x). 2. 1. Flow chart. S=0. for n=1:N. sn=floor(n^2)+ceil(2*n/3) S=S+sn. Symbolic Differentiation. >> x=sym('x'); >> diff(tanh(x)) ans = 1-tanh(x)^2.

E N D
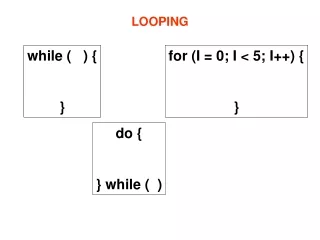
Lecture 5 FOR Looping • Summation • Symbolic differentiation • Counting ATCG 軟體實作與計算實驗
Summation x = 1.5 x = 1.5 floor(x) ceil(x) 2 1 軟體實作與計算實驗
Flow chart S=0 for n=1:N sn=floor(n^2)+ceil(2*n/3) S=S+sn 軟體實作與計算實驗
Symbolic Differentiation >> x=sym('x'); >> diff(tanh(x)) ans = 1-tanh(x)^2 軟體實作與計算實驗
Symbolic differentiation >> x=sym('x'); >> diff(x.^3+2*x) ans = 3*x^2+2 軟體實作與計算實驗
Symbolic Differentiation demo_diff.m • Input a string, fstr • Plot the function specified by fstr • Plot the derivative of the given function 軟體實作與計算實驗
Example function of x:tanh(x) fx1 = Inline function: fx1(x) = 1-tanh(x).^2 軟體實作與計算實驗
Histogram • Sample space of a die: {1,2,3,4,5,6} • Count occurrences of outcomes 軟體實作與計算實驗
Create a sample n=1000; s=ceil(rand(1,1000)*6); h=hist(s,[1 2 3 4 5 6]); 軟體實作與計算實驗
hist(s,[1 2 3 4 5 6]) 軟體實作與計算實驗
c=s(i); count(c) = count(c) +1; 軟體實作與計算實驗
Flow chart : n=length(s); count=zeros(1,6); for i=1:n c = s (i); count(c) = count(c)+1; 軟體實作與計算實驗
n=length(s); count=zeros(1,6); for i=1:n c = s (i); count(c) = count(c)+1; end 軟體實作與計算實驗
Flow chart : n=length(s); count=zeros(1,6); for i=1:6 ind = find(s==i); count(i) = length(ind); 軟體實作與計算實驗
n=length(s); count=zeros(1,6); for i=1:6 ind = find(s==i); count(i) = length(ind); end 軟體實作與計算實驗
DNA sequence ATCG sequence load mitochondria mitochondria(1:200) 軟體實作與計算實驗
mitochondria(1:200) gatcacaggtctatcaccctattaaccactcacgggagctctccatgcatttggtattttcgtctggggggtgtgcacgcgatagcattgcgagacgctggagccggagcaccctatgtcgcagtatctgtctttgattcctgcctcattctattatttatcgcacctacgttcaatattacaggcgaacatacctacta 軟體實作與計算實驗
ATCG • Calculate probabilities of a,t,c,g occurring in a given ATCG sequence. 軟體實作與計算實驗
Switch cc=mitochondria(i); switch cc case 'a' count(1)=count(1)+1; case 't' count(2)=count(2)+1; case 'c' count(3)=count(3)+1; case 'g' count(4)=count(4)+1; end 軟體實作與計算實驗
Flow chart load mitochondria n=length(mitochondria); count=zeros(4); for i =1:n cc=mitochondria(i); switch cc . . . end 軟體實作與計算實驗
load mitochondria n=length(mitochondria); count=zeros(1,4); for i =1:n cc=mitochondria(i); switch cc case 'a' count(1)=count(1)+1; case 't' count(2)=count(2)+1; case 'c' count(3)=count(3)+1; case 'g' count(4)=count(4)+1; end end 軟體實作與計算實驗