Download
1 / 20
200 likes | 301 Views
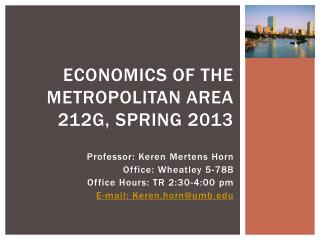
Economics of the metropolitan area 212G, Spring 2013. Professor: Keren Mertens Horn Office: Wheatley 5-78B Office Hours: TR 2:30-4:00 pm E-mail: Keren.horn@umb.edu. Recap: Costs of cars. Gas Time Wear and tear on road Pollution Accidents AND CONGESTION. Recap: economic concepts.

E N D
Economics of the metropolitan area212G, Spring 2013 Professor: Keren Mertens Horn Office: Wheatley 5-78B Office Hours: TR 2:30-4:00 pm E-mail: Keren.horn@umb.edu
Recap: Costs of cars • Gas • Time • Wear and tear on road • Pollution • Accidents • AND CONGESTION
Recap: economic concepts • PARETO IMPROVEMENT • A change that makes some people better off and no one worse off. • EXTERNALITY • Cost (benefit) that is not borne directly by the person who decides about incurring it. • MORAL HAZARD • The tendency of a person who is imperfectly monitored to engage in undesirable behavior. • FIXED COST vs. MARGINAL COST • FIXED COST – costs that do not vary with the quantity of output produced • MARGINAL COST – increase in total cost that arises from an additional unit of input
Congestion has costs • According to Texas Transportation Institute (2012)*: • Average US commuter lost 52 hours due to traffic congestion • In some metropolitan areas costs were higher: • In Washington DC 67 hours (MSA with highest congestion) • In Los Angeles and San Francisco 61 hours (Second highest) • In New York 59 hours (Fourth highest) • In Boston 53 hours (Fifth highest) • Up from 47 hours in 2011 • Texas Transportation Institute measures the costs of congestion at $121 billion a year, which is about $818 for each commuter • Costs associated with congestion appear to be growing • Average peak period driver lost three times as much to congestion in 2002 as in 1982 *http://mobility.tamu.edu/ums/national-congestion-tables/
Policy responses to congestion • Do nothing call this “come as you please” system • People will bear two types of costs: • Waiting costs – costs you bear when you wait, are proportional to amount of time you wait • Schedule delay costs – costs you bear when using a facility at a time that isn’t optimal for you in order to avoid waiting
Come as you please system Assume: All drivers are the same (need to be at work at 9). Cost They have been striving to reduce commute time for a while so no time can be any better than any other time. $32 And costs of congestion are $32. 9:50 am 5:50 am 8:30 am Time of Arrival
Come as you please system Cost $32 Waiting Time Cost 9:50 am 5:50 am 8:30 am Time of Arrival
Come as you please system Equilibrium: situation in which everyone is doing as well as they can, given correct beliefs about how everyone else will behave Cost $32 Schedule Delay Cost Schedule Delay Cost Waiting Time Cost 9:50 am 5:50 am 8:30 am Time of Arrival
Numerical example • Problem Parameters: • Lincoln tunnel can handle 1,000 cars an hour • 4,000 cars want to enter the tunnel at 8:30 am to get to work at 9:00am • Going in early costs each household $0.20 per minute • Going in late costs each household $0.40 per minute • Waiting in line costs them $0.30 per minute • Question 1: How long does it take everyone to get through the tunnel? • 4,000 cars / 1,000 cars per hour = 4 hours
Numerical example • Problem Parameters: • Lincoln tunnel can handle 1,000 cars an hour • 4,000 cars want to enter the tunnel at 8:30 am to get to work at 9:00am • Going in early costs each household $0.20 per minute • Going in late costs each household $0.40 per minute • Waiting in line costs them $0.30 per minute • Question 2: When will the latest and earliest cars arrive? • Twice as bad to be late by 1 minute as to be early by 1 minute, so earliest car will arrive twice as early as the latest arrival is late. • First car will arrive at 5:50 am (160 minutes early) • Last car will arrive at 9:50 am (80 minutes early)
Numerical example • Problem Parameters: • Lincoln tunnel can handle 1,000 cars an hour • 4,000 cars want to enter the tunnel at 8:30 am to get to work at 9:00am • Going in early costs each household $0.20 per minute • Going in late costs each household $0.40 per minute • Waiting in line costs them $0.30 per minute • Question 3: How much total cost does each driver bear? • Earliest driver bears: ($0.20 x 160) = $32 • Latest driver bears: ($0.40 x 80) = $32 • Everyone in between must bear this same cost, which is partially a waiting cost and a schedule delay cost
Numerical example • Problem Parameters: • Lincoln tunnel can handle 1,000 cars an hour • 4,000 cars want to enter the tunnel at 8:30 am to get to work at 9:00am • Going in early costs each household $0.20 per minute • Going in late costs each household $0.40 per minute • Waiting in line costs them $0.30 per minute • Question 4: What is the total cost? What is the waiting cost? What is the schedule delay cost? • Total Cost : (4,000 cars x $32) = $128,000 • Waiting Cost: ½ Base x Height or (1/2 x 4,000 cars x $32) = $64,000 • Schedule Delay Cost: Remainder or $64,000
Policy responses to congestion • Do nothing call this “come as you please” system • People will bear two types of costs: • Waiting costs – costs you bear when you wait, are proportional to amount of time you wait • Schedule delay costs – costs you bear when using a facility at a time that isn’t optimal for you in order to avoid waiting • Reservations? • People would show up exactly at their scheduled time, so there would be no waiting costs • From numerical example will still take 4 hours to get everyone through, so will still have schedule delay costs • Will have no waiting costs, so will cut costs in half
Reservation system Cost $32 Schedule Delay Cost Schedule Delay Cost Waiting Time Cost = 0 9:50 am 5:50 am 8:30 am Time of Arrival
Policy responses to congestion • Do nothing call this “come as you please” system • People will bear two types of costs: • Waiting costs – costs you bear when you wait, are proportional to amount of time you wait • Schedule delay costs – costs you bear when using a facility at a time that isn’t optimal for you in order to avoid waiting • Reservations? • People would show up exactly at their scheduled time, so there would be no waiting costs • From numerical example will still take 4 hours to get everyone through, so will still have schedule delay costs • Will have no waiting costs, so will cut costs in half • Not everyone is equally well off • Person with $32 schedule delay cost would be willing to pay $32 to get the 0 waiting time slot • Feasible?
Policy responses to congestion • Congestion Pricing: • Impose a toll that varies by arrival times and that is equal to the cost a driver imposes on others • From our numerical example this toll would be $0 at 5:50, go up to $32 at 8:30 and back to $0 at 9:50. • This toll would make people bear all the costs that they impose on others (internalize the externality) • Tax that makes people bear all the costs of their decisions is called a Pigouvian Tax
Designing an optimal toll system Cost $32 Schedule Delay Cost Schedule Delay Cost Cost Imposed on Others 9:50 am 5:50 am 8:30 am Time of Arrival
Designing an optimal toll system Cost $32 Schedule Delay Cost Schedule Delay Cost Toll 9:50 am 5:50 am 8:30 am Time of Arrival
Policy responses to congestion • Congestion Pricing: • Impose a toll that varies by arrival times and that is equal to the cost a driver imposes on others • From our numerical example this toll would be $0 at 5:50, go up to $32 at 8:30 and back to $0 at 9:50. • This toll would make people bear all the costs that they impose on others (internalize the externality) • Why are people better off? • Everyone still pays $32, either in toll or in schedule delay costs • BUT waiting costs are pure waste and tolls are a transfer • Tolls can be used to rebate everyone who uses the tunnel or it could be used to improve transportation in other ways which benefit citizens
Discussion • Do you believe that congestion pricing can reduce congestion? • Why do you think congestion pricing ultimately failed in NYC? • What changes could have been made to NYC’s plan to make it more appealing? • Do you agree with the author’s conclusion that gaining broad public acceptance of congestion pricing requires changing how motorists see pricing as affecting their own best interests? • Would you support a system of congestion pricing in Boston? • Where would you implement this system? • What price would you be willing to pay for congestion pricing to not have to sit in traffic? • What services would you require in return for congestion pricing? • Would a system like the one we are suggesting here be politically feasible?