Download
1 / 69
690 likes | 851 Views
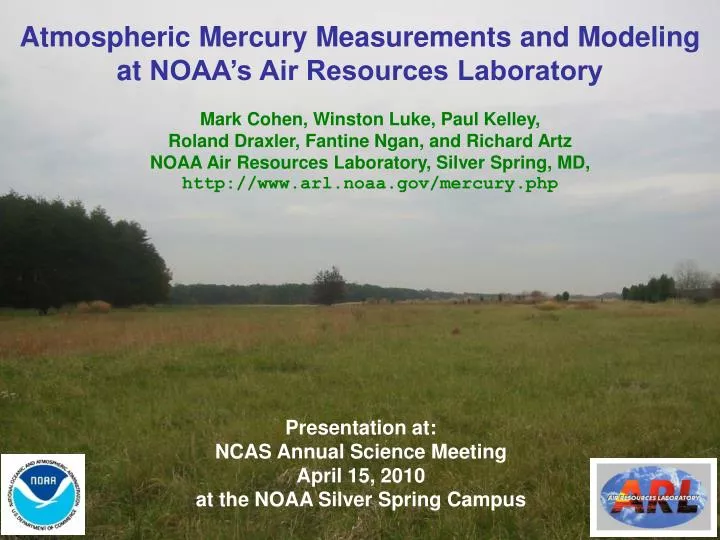
Atmospheric Mercury Measurements and Modeling at NOAA’s Air Resources Laboratory. Mark Cohen, Winston Luke, Paul Kelley, Roland Draxler, Fantine Ngan, and Richard Artz NOAA Air Resources Laboratory, Silver Spring, MD, http://www.arl.noaa.gov/mercury.php. Presentation at:

E N D
Atmospheric Mercury Measurements and Modeling at NOAA’s Air Resources Laboratory Mark Cohen, Winston Luke, Paul Kelley, Roland Draxler, Fantine Ngan, and Richard Artz NOAA Air Resources Laboratory, Silver Spring, MD, http://www.arl.noaa.gov/mercury.php Presentation at: NCAS Annual Science Meeting April 15, 2010 at the NOAA Silver Spring Campus
1. Measurements • Site Locations and Settings Current Suite of Measurements Intensive (this Summer) Data – some examples 2. Modeling • Episodes for Model Evaluation Emissions and Met Data -- Fine-Scale Evolution of the HYSPLIT-Hg Model Upcoming Great Lakes Project
Canaan Valley Institute [CVI–NOAA] Beltsville [EPA-NOAA] Grand Bay NERR NOAA-MSDEP Allegheny Portage [CVI-PA-NOAA] Four NOAA associated sites committed to emerging inter-agency speciated mercury ambient concentration measurement network (comparable to Mercury Deposition Network (MDN) for wet deposition, but for air concentrations)
Atmospheric Mercury Initiative http://nadp.sws.uiuc.edu/AMN/
Beltsville, Maryland Co-located with the EPA’s CASTNet site, and the Beltsville NTN and MDN sites
Monitoring sites rural AQS other AQS NADP/MDN CASTNet Symbol color indicates type of mercury source Hg site IMPROVE coal incinerator metals manuf/other Symbol size and shape indicates 1999 mercury emissions, kg/yr 1 - 50 50 - 100 100 - 200 200 – 400 400 - 700 700 – 1000 > 1000 Beltsville monitoring site Brunner Island Large Incinerators: 3 medical waste, 1 MSW, 1 haz waste (Total Hg ~ 500 kg/yr) Harford County MSW Incin Brandon Shores and H.A. Wagner 100 miles from DC Montgomery County MSW Incin Eddystone Dickerson Arlington - Pentagon MSW Incin Possum Point Chalk Point Morgantown Bremo
5 km Patuxent River Patuxent Research Refuge (FWS) Patuxent Wildlife Research Center (USGS) Howard University Atmos. Site ( + NASA, NSF, NOAA, others) Beltsville Agricultural Research Center (USDA) Beltsville Atmospheric Monitoring Site (EPA, NOAA, State of MD, Univ. of MD)
Atmospheric Mercury Measurement Site at Beltsville, MD Top of tower (close-up) with two sets of RGM and Hg(p) collectors ARL’s Winston Luke working with RGM and Hg(p) collectors After RGM and Hg(p) is collected, it is desorbed and analyzed inside the trailer, along with Hg(0) Precipitation measurements (left to right): Mercury Deposition Network, Major Ions (e.g.”acid rain”), Precipitation Amount mercury and trace gas monitoring tower (10 meters)
Grand Bay National Estuarine Research Reserve (NERR), Mississippi Co-located with the MS-DEQ / EPA’s precipitation measurements sites (NTN, MDN, and trace metals)
Grand Bay NERR sampling site, with large point sources of Reactive Gaseous Mercury in the region, based on the EPA’s 2002 National Emissions Inventory Mississippi Alabama Lowman Brewton paper mill* size/shape of symbol denotes amount of Reactive Gaseous Mercury (RGM) emitted during 2002 (kg/yr) Hattiesburg Barry Eaton 5 - 10 Gaylord Container Bogalusa Florida IPSCO Steel *** 10 - 50 Mobile 50 - 100 Crist 100 – 300 Daniel color of symbol denotes type of mercury source Watson Louisiana Pensacola coal-fired power plants Biloxi- Gulfport Pascagoula other fuel combustion Slidell waste incineration Pascagoula MSW incinerator ** Grand Bay NERR monitoring site metallurgical manufacturing & other New Orleans urban areas * Brewton paper mill mercury emissions included in 2002 NEI, but do not appear to be in 2000-2008 TRI ** Pascagoula MSW incinerator mercury emissions included in 2002 NEI but incineration ceased in Jan 2001 *** Ipsco Steel had significant mercury emissions in 2002 NEI, but negligible emissions reported in 2008 TRI
Current Location of Site view from top of the tower mercury and trace gas monitoring tower (10 meters)
“Hmmm…maybe it would work better if we have the tower go vertical?” Winston Luke (Principal Investigator, NOAA – Air Resources Laboratory) and Jake Walker (site operator, Grand Bay National Estuarine Research Reserve)
Current Atmospheric Measurements at the Grand Bay NERR “Speciated” Atmospheric Mercury Concentrations Trace gases and other measurements to help understand and interpret mercury data Meteorological Data
Instrumentation inside the trailer at the Grand Bay NERR site
Timeline of Site Activities at the Grand Bay NERR Summer 2010: Field Intensive (being planned) Sept 2006: Speciated Hg, SO2, O3, and CO measurements begin at “inland” site Aug 21 – Oct 5, 2008: site shut down due to threat of hurricanes Jan 2010: Black Carbon added Jan 2008: NO/NOy added 2005-2006: site selection 2005 2006 2007 2008 2009 2010 Feb 2007: Meteorological measurements added Oct 2007: Move to “coastal” site near Pavillion; 2nd Tekran speciated Hg measurement suite added 2010: Wet Deposition measurements being added
Canaan Valley, West Virginia Operated by Steve Brooks of the Canaan Valley Institute, who also runs an AIRMon-Wet site, a new MDN site, and carries out several other Hg measurements as well
CVI’s Research Area is the Mid-Atlantic Highlands NOAA performs the Mercury and Air Quality Studies
Canaan Valley non-Network Mercury Measurements Continuous gaseous elemental mercury surface fluxes (modified-Bowen ratio) Weekly total mercury snow pack and stream outflow (calibrated stream gauge) Monthly groundwater Total mercury in Throughfall (event/campaign) Weekly Cat-ion exchange membrane surrogate surfaces
Canaan Valley Hg Site Ultrasonic anemometer for wind turbulence Charge dissipater for Lightning protection Vertical profilers for mercury Air-surface exchange Mercury chemical composition sensors Rain and Snow collectors for Mercury and Acid Rain Shelter for sensors measuring mercury, ozone, carbon dioxide and other trace gases
Allegheny Portage Railroad National Historic Site, Pennsylvania Co-located with the MS-DEQ / EPA’s precipitation measurements sites (NTN, MDN, and trace metals)
PA13 Allegheny Portage
Numbers in facility labels are kg/yr emissions of elemental, reactive gaseous, and particulate mercury, respectively Shawville e096, r255, p023 Armstrong e039, r102, p009 Interpower Colver e10, r10, p15 PA13 Allegheny Portage Keystone e203, r537, p048 Homer City e080, r213, p019 Cambria Cogenco e10, r10, p14 Reliant Seward e10, r13, p03 Conemaugh e213, r018, p001
PA13 Allegheny Portage
1. Measurements • Site Locations and Settings Current Suite of Measurements Intensive (this Summer) Data – some examples 2. Modeling • Episodes for Model Evaluation Emissions and Met Data -- Fine-Scale Evolution of the HYSPLIT-Hg Model Upcoming Great Lakes Project
Summary of NOAA ARL Mercury Measurement Sites • NOAA-led measurement • Co-located measurement
1. Measurements • Site Locations and Settings Current Suite of Measurements Intensive (this Summer) Data – some examples 2. Modeling • Episodes for Model Evaluation Emissions and Met Data -- Fine-Scale Evolution of the HYSPLIT-Hg Model Upcoming Great Lakes Project
1. Measurements • Site Locations and Settings Current Suite of Measurements Intensive (this Summer) Data – some examples 2. Modeling • Episodes for Model Evaluation Emissions and Met Data -- Fine-Scale Evolution of the HYSPLIT-Hg Model Upcoming Great Lakes Project
Beltsville site is impacted by a variety of local-regional sources with unique emissions characteristics. Coupled chemical-meteorological analysis will yield important insights into mercury emissions, transport, transformation, and removal at the site.
Two systems were configured identically (pink), then System 2 was fitted with a 10-micron cut point elutriator (blue) over the course of several days. Results suggest that there may be as much mercury in the coarse (sea salt) aerosol fraction as in the fine fraction. Studies will be repeated periodically at the site.
1. Measurements • Site Locations and Settings Current Suite of Measurements Intensive (this Summer) Data – some examples 2. Modeling • Episodes for Model Evaluation Emissions and Met Data -- Fine-Scale Evolution of the HYSPLIT-Hg Model Upcoming Great Lakes Project
NOAA HYSPLIT MODEL Lagrangian Puff Atmospheric Fate and Transport Model 0 1 2 TIME (hours) The puff’s mass, size, and location are continuously tracked… = mass of pollutant (changes due to chemical transformations and deposition that occur at each time step) Phase partitioning and chemical transformations of pollutants within the puff are estimated at each time step Initial puff location is at source, with mass depending on emissions rate Centerline of puff motion determined by wind direction and velocity Dry and wet deposition of the pollutants in the puff are estimated at each time step. deposition 2 deposition to receptor deposition 1 lake
1. Measurements • Site Locations and Settings Current Suite of Measurements Intensive (this Summer) Data – some examples 2. Modeling • Episodes for Model Evaluation Emissions and Met Data -- Fine-Scale Evolution of the HYSPLIT-Hg Model Upcoming Great Lakes Project
Hg from other sources: local, regional & more distant Measurement of ambient air concentrations Measurement of wet deposition
initial emphasis is model evaluationfocusing on episodes
December 24, 2007: Large peaks in RGM and SO2
February 10, 2008: Large peaks in RGM and SO2
April 20-23, 2008: Large peaks in RGM and SO2 45
1. Measurements • Site Locations and Settings Current Suite of Measurements Intensive (this Summer) Data – some examples 2. Modeling • Episodes for Model Evaluation Emissions and Met Data -- Fine-Scale Evolution of the HYSPLIT-Hg Model Upcoming Great Lakes Project
Hg from other sources: local, regional & more distant atmospheric deposition to the water surface atmospheric deposition to the watershed Measurement of ambient air concentrations Measurement of wet deposition An essential factor in carrying out a meaningful model evaluation in cases where local/regional sources may be important is to have accurate emissions data for local/regional sources, valid for the time of the episode being studied
Grand Bay NERR sampling site, with large point sources of Reactive Gaseous Mercury in the region, based on the EPA’s 2002 National Emissions Inventory Mississippi Alabama Lowman Brewton paper mill* size/shape of symbol denotes amount of Reactive Gaseous Mercury (RGM) emitted during 2002 (kg/yr) Hattiesburg Barry Eaton 5 - 10 Gaylord Container Bogalusa Florida IPSCO Steel *** 10 - 50 Mobile 50 - 100 Crist 100 – 300 Daniel color of symbol denotes type of mercury source Watson Louisiana Pensacola coal-fired power plants Biloxi- Gulfport Pascagoula other fuel combustion Slidell waste incineration Pascagoula MSW incinerator ** Grand Bay NERR monitoring site metallurgical manufacturing & other New Orleans urban areas * Brewton paper mill mercury emissions included in 2002 NEI , but do not appear to be in 2000-2008 TRI ** Pascagoula MSW incinerator mercury emissions included in 2002 NEI but incineration ceased in Jan 2001 *** Ipsco Steel had significant mercury emissions in 2002 NEI, but negligible emissions reported in 2008 TRI
Mercury Air Emissions from the Victor J. Daniel Power Plant as reported to the Toxic Release Inventory
Mercury Air Emissions from Charles R. Lowman Power Plant as reported to the Toxic Release Inventory