Download
1 / 29
290 likes | 413 Views
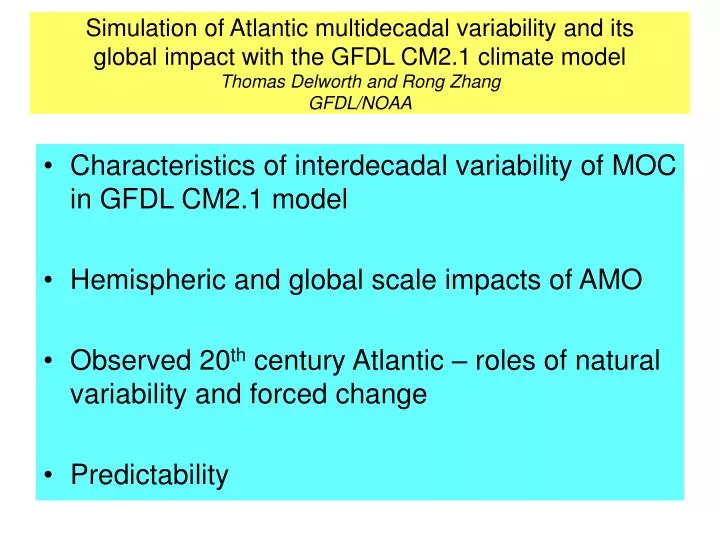
Simulation of Atlantic multidecadal variability and its global impact with the GFDL CM2.1 climate model Thomas Delworth and Rong Zhang GFDL/NOAA. Characteristics of interdecadal variability of MOC in GFDL CM2.1 model Hemispheric and global scale impacts of AMO

E N D
Simulation of Atlantic multidecadal variability and itsglobal impact with the GFDL CM2.1 climate model Thomas Delworth and Rong ZhangGFDL/NOAA • Characteristics of interdecadal variability of MOC in GFDL CM2.1 model • Hemispheric and global scale impacts of AMO • Observed 20th century Atlantic – roles of natural variability and forced change • Predictability
GFDL CM2.1 Model(additional details and model output available at nomads.gfdl.noaa.gov/CM2.X) • Atmosphere: approx 2o horizontal resolution, 24 vertical levels, diurnal cycle, 3 hour timestep for physics • Ocean: 1o horizontal resolution in extratropics, 1/3o at Equator, tripolar grid; 50 vertical levels; MOM4 code, z coordinate; GM,KPP,tidal mixing, true fresh water boundary condition • Dynamic sea ice model; land model • Ocean-Atmosphere coupling every 2 hours; no flux adjustments • Used for complete set of IPCC integrations; independently assessed to be in top tier of models worldwide
SST anomalies associated with interdecadal MOC fluctuations Small Tropical Amplitude
Anomalous mixed layer depths (meters) preceding a MOC maximum
Time-latitude plot of SLP anomalies associated with maximum in MOC MOC decreasing MOC increasing MOC maximum Pattern of SLP anomalies preceding a MOC maximum
Anomalous poleward heat transport in Atlantic/Arctic associated with MOC maximum Atlantic Heat Transport (1014 Watts) MOC maximum MOC increasing MOC weakening
JJA Precipitation Anomalies Associated with Maximum MOC Units: cm/day
JJA: Change in Vertical Shear of zonal wind (850mb-300mb) Associated with Maximum MOC
Key Issues • What sets the timescale? (spectral peak around 20 yrs; similar to CCSM3) • What is the mechanism? (stochastic excitation of oceanic mode?) • How robust are these fluctuations? • Are these related to the observed AMO? • “Should” there be a larger tropical signal associated with these? • LATER: Predictability of these fluctuations. • NEXT: Hemispheric-global impact of AMO-like fluctuations.
Hybrid coupled model(based on GFDL CM2.1) Global Atmosphere/Land System Heat Water Momentum Heat Heat Water Mom. Pacific Dynamic Ocean Atlantic Slab Ocean Indian Dynamic Ocean Constant Flux Adjustment Time varying heating to induce AMO-like SST variations
Definition of AMO Index: 10-yr Low-pass filtered (LF) mean SST anomaly over the North Atlantic basin (0-66oN), detrended Observed AMO Index (HadISST) Modeled AMO Index (10-member ensemble mean)
Regression of modeled LF JJAS Rainfall Anomaly on modeled AMO Index Modeled AMO Index Regression of observed LF JJAS Rainfall Anomaly (CRU data) on observed AMO Index Observed AMO Index
Observed AMO Index Modeled AMO Index Observed LF major Hurricane number anomaly and LF anomalous ASO vertical shear of zonal wind (m/s) Modeled LF anomalous ASO vertical shear of zonal wind (m/s)
Reduction in Wind Shear when North Atlantic Warms relative to South Atlantic Observations Model (GFDL CM2.1) Zhang and Delworth, GRL,2006 Red means less shear, and therefore more favorable conditions for hurricanes. CONCLUSION: Models demonstrate that a warming North Atlantic (relative to the South Atlantic) CAUSES atmospheric circulation changes that are favorable for tropical activity.
Simulated multidecadal JJAS surface air temperature difference (K) (1931-1960) –(1961-1990)
Atlantic constrained experiment (ACE) Radiatively forced experiment (RFE)
Key points so far … • Hybrid coupled model used to evaluate impact of AMO-like SST fluctuations on global climate • AMO fluctuations • Generate multidecadal fluctuations in Sahel and Indian summer rainfall • Modulate the vertical shear of the zonal wind over the main development region for Atlantic hurricanes • Influence summer temperature over North America and Europe • Have a remote impact in Pacific, leading to a PDO-like pattern of SST anomalies • Crucial issues: • How much of AMO-like behavior is internal variability versus forced climate change? • To what extent are AMO fluctuations generated internally in the Atlantic versus forced from other parts of the globe?
Recent Atlantic Changes • Can we decompose observed Atlantic changes over the last century into forced change and internal variability? • This is crucial for many issues, including interpretations of Sahel drought and increased hurricane activity.
Attempts to decompose observed Atlantic signal into forced and internal variability components … very difficult to do. For both: “Internal variability” defined as observations minus estimate of forced signal. Indo-Pacific average Method A: Forced signal derived from statistical model. Method B: Forced signal derived as mean over Indian and Pacific basins. Observed SST
Observed and Modeled Tropical North Atlantic SST Modeled (GFDL CM2.1) Observed Key uncertainty: Role of aerosols In late 20th century Steady or slightly cooling temps Rapid Warming
Histogram of NH extratropical temperatures (2001-2010) Two ensembles, initialized from different ocean conditions on 1 Jan 2001.
Key Issues: • How much impact is there for continental climate? Results to date are mixed, even in perfect predictability experiments. • Does this translate into predictability of atmospheric circulation of climatic relevance (ie, tropical conditions relevant to hurricanes; Pacific SST patterns of relevance for North American drought). • Are our current models a fair evaluation of the actual predictability in the system? - Are our models good enough? - Do model atmospheres interact with the ocean realistically? - Are we missing inherent types of oceanic variability? (d) Are observing and assimilation systems up to the challenge?
Summary and Discussion • GFDL CM2.1 has pronounced interdecadal variability of Atlantic MOC, with a timescale of ~ 20 years (similar to CCSM3). • CM2.1 MOC fluctuations associated with regional to hemispheric changes, including modulating ITCZ and temperature. • On multi-year timescales there is some basis for predictability, probably originating in ocean • Substantial challenge for models, observations, and assimilation systems • Currently working on improved coupled models, including increased resolution, better numerics, and improved physics.
Impact of observational network on “observation” of MOC CONCLUSION: ARGO network plus atmospheric assimilation allows accurate “observation” of MOC in perfect model context. (S. Zhang, personal communication)
Observed Atlantic Sea Surface Temperature (SST) Temperature (Deg C) (60oW-20oW,6oN-18oN) Tropical North Atlantic