Download
1 / 57
580 likes | 765 Views
Groundwater pollution by Nitrate transport through soil column at Hada Asham region, Saudi Arabia. Khaled S. Balkhair Water Resources Research King Abdulaziz University Saudi Arabia. Contents. 1. Objective of the study. 2. Mathematical models. 3. Study area. Application. 4.

E N D
Groundwater pollution by Nitrate transport through soil column at Hada Asham region, Saudi Arabia Khaled S. Balkhair Water Resources Research King Abdulaziz University Saudi Arabia
Contents 1 Objective of the study 2 Mathematical models 3 Study area Application 4 Results & Conclusions 5
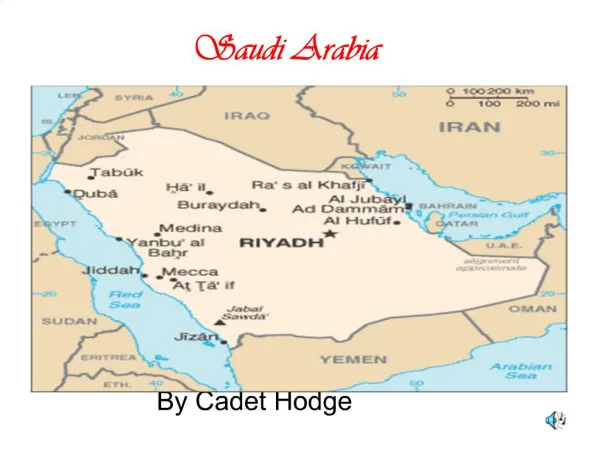
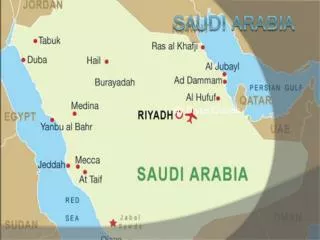
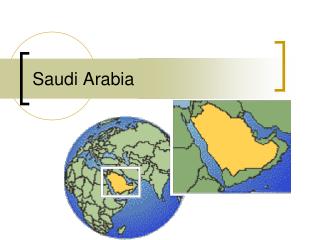
Objective of the study Experimentally monitor and numerically model the transport of nitrate in a real soil column of Hada Asham (western region of Saudi Arabia) to predict its leach to the groundwater table
Powdered formula mixed with tap water could contain nitrate. Nitrogen in our environment Blue Baby Syndrome Algae Bloom methemoglobinemia An illness that occurs when a child drinks water containing a large amount of nitrates. The body’s digestive system converts these to nitrites, changing oxyhemoglobin to metheglobin, which cannot carry oxygen. Mucous membranes turn blue, impairing functions. Tiny water plants capture the sun’s energy and support the food web. Dissolved nitrogen can lead to sudden overabundance, which blocks sunlight to water, kills fish by using the water’s oxygen, produces scum or odor, and in some cases, produces toxins.
Nitrogen in our environment Agricultural Fertilizer Young Animal Illness High levels of nitrate in water lead to increased livestock and wildlife stillbirth rates, low birth weight, slow weight gain, and reduced vitality. Living organisms use nitrogen to build proteins, enzymes, DNA, RNA, vitamins, and hormones. Most animals derive their nitrogen from plants, which convert simple compounds to more complex ones. Adding simple nitrogen compounds to soil increases plant growth.
Nitrogen in our environment Sewers and Septic Tanks Sterile Food Packing Cream Whipper Chargers Oxygen allows bacterial growth and chemical breakdown of foods. Food is often vacuum-packed to remove oxygen or packed with nitrogen. N2O is soluble in fats and used as a propellant for canned whipped cream. Human urine contains a large amount of ammonia. Soil bacteria oxidize ammonia to form nitrates. Leaking septic tanks or sewer systems release the wastes into the soil, groundwater, and surface water systems.
Nitrogen in our environment Dentistry/Medicine Meat Preservative Nitrous oxide (N2O), also known as “laughing gas,” is a mild anesthetic used in dentistry. Nitric oxide (NO) is a short-lived gas that acts as a signaling molecule in the body for blood pressure. “Nitro” drugs like nitroglycerin lower blood pressure by increasing NO. Sodium nitrite is a salt that prevents bacterial growth and botulism. When added to meat, the nitrite turns to nitric oxide and combines with myoglobin, the red pigment in meat, turning it the pink color of ham and hotdogs.
Nitrogen in our environment Lightning Strikes Soil Bacteria The high temperatures and pressures that surround electric storms form nitric oxide (NO) and nitrogen dioxide (NO2), which reacts with rain to form nitric acid (HNO3). Nitrates formed by the interaction of nitric acid and soil provide nitrates for plant growth. Microbes in the ground conduct denitrification, a process that converts nitrates back to nitrogen gas. This process also produces nitrous oxide, which is a greenhouse gas contributing to global warming.
Nitrogen in our environment Farm Animal Waste Paper Industry The pulp and paper industry processes wood with heat, pressure and caustic solutions. Possible polluting byproducts include methanol, NOx and carbon dioxide emissions, and ammonia and nitrates releases in sludge or wastewater. Barnyards, dairies, and feedlots produce a lot of animal waste. Bacteria convert the ammonia in this waste to nitrates that enter the ground or surface water systems. Bacteria from animal waste is also a contaminant.
Is N Toxic? • Spinach is one of the largest accumulators of nitrate • Nitrite and N-nitrous compounds • found in numerous animal studies to becarcinogenic • (U.S. Dept. of Health and Human Services 1998). • nitrate exposure ► methemoglobinemia (blue baby syndrome) in infants Associations between nitrate in drinking water and chronic health problems: • hyperthyroidism (goiter) linked to exposure to nitrate in drinking water • (Seffner 1995; VanMaanen et al. 1994); • An increased risk for central nervous system malformations in newborns • whose mothers had consumed private well water equal to or greater • than 26 ppm NO3-N (Arbuckle et al. 1988);
Genotoxic effects at the chromosomal level reported in persons • consuming water with very high nitrate levels • (Van Maanen et al. 1996; Tsezou et al. 1996) Elevated mortality rates of stomach cancer associated with high levels of nitrate in water supplies (Morales-Suarez et al. 1995); A positive correlation between mortality rates of bladder cancer and nitrate levels in drinking water (Morales-Suarez et al. 1993);
Mathematical model Water flow equation PDE – 1D – WF – Richard’s Eq. Or θ =θ(h) is the volumetric water content, h = h(z, t) is the matric potential, z is the position coordinate in the direction of flow; K(h) is the hydraulic conductivity of the soil at matric potential C(h) is the specific water capacity.
Initial condition Specified head Uniform or non-uniform matric potential Uniform or non-uniform water content Boundary conditions Specified at both ends of domain Matric potential Flux Rainfall Ponding PDE solution Requirements: θ(h) and K(h) Solution: h(z , t).
Soil water proprieties Empirical relationship :Van Genuchten (1980) (h) = f(s , r, , n, m)
By: D.L. Nofziger and Jinquan Wu, 2000 2. CHEMFLO Interactive Software for Simulating Water and Chemical Movement in Unsaturated Soils Water flow: Richards equation (Richards, 1931) Chemical flow: convection-dispersion equation Solution method: Finite difference Computer codes 1. RETC M. Th. van Genuchten, F. J. Leij and S. R. Yates, 1991 For Quantifying the Hydraulic Functions of Unsaturated Soils
convection-dispersion equation c = c(x,t): is the concentration of chemical in the liquid phase S=S(x,t): is the concentration of chemical in the solid phase D=D(x,t): is the dispersion coefficient q = q(x,t): is the flux of water ρ = ρ(x): is the soil bulk density α,β : Degradation rates γ : Production rate Governing Partial Differential Equation for Chemical Movement
Numerical solution Finite Difference Scheme Water flow equations
Study Area Jeddah Makkah
Experiments Constant head permemeter Ks= 13.6 cm/hr
Soil moisture retention Pressure plate apparatus
Fitting equation to data RETC code: Van Genuchten (1991) n = 2.037 = 0.0221 cm-1
BTC q = 10.03 cm/hr Co= 50 mg/l D = 2.3 cm2/hr
Experiment 1: Flow in initially dry soil Initial h = -500 cm Constant q = 10.03 cm/hr Duration = 3.3 hrs
Breakthrough curves of NO3- at sensor locations Nitrate concentration along soil column at different times Experiment 2: NO3leach Initial condition: Depth (cm)Matric potential (cm) 0 -7 10 -13 40 -65 70 -88 100 -114 140 -201 Flux = 5 cm/hr Co = 50 mg/l Duration = 1 hr
Irrigation scheme and rainfall events used in the simulation Experiment 3:Nitrate leach to groundwater table Field: Hada Asham Crop: Alfalfa Area: 3.46 ha Irrigation schedule: 8 hr/day Duration: each day another Fertilizer: Urea + Potassium sulphate Groundwater table: 20 – 25 m Constant percolation = 0.08 cm/hr