Download
1 / 17
170 likes | 349 Views
WNA Fuel Market Report Part Two - Supply. Name – Sashi Davies Position - Head of Marketing, Extract Resources. WNA Symposium 12 th September 2013. Uranium supply – demand sources. Uranium mining. Secondary sources. Reactor related uranium demand. Additional demand. SUPPLY. DEMAND.

E N D
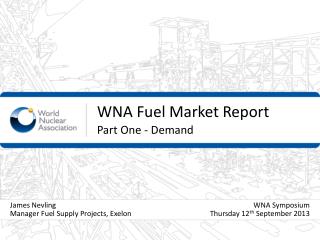
WNA Fuel Market ReportPart Two - Supply Name – Sashi Davies Position - Head of Marketing, Extract Resources WNA Symposium 12th September 2013
Uranium supply – demand sources Uranium mining Secondary sources Reactor related uranium demand Additional demand SUPPLY DEMAND • Main factors of demand/supply relationship • Favorable uranium prices • Sufficient and qualitative uranium resources • Uranium production capacities • HEU-LEU Program • US policy in the uranium inventory reduction and stock balance selling • Policy in depleted U, spent fuel and HEU reprocessing • Selection of tails assay • Load factors • Extending cycle length and enrichment levels • Improved fuel design and management • Increased burn up • Uranium as a trading commodity (stocks trading) • Inventories build
World Uranium Resources • The amount of identified resources in the Red Book continues to increase rapidly • The overall cost of mining these resources has increased • Most of these resources are found in four countries (Australia, Kazakhstan, Russia, Canada)
Historical Uranium Production – Western World Production was substantially ahead of reactor requirements until 1985, but has since fallen below. Since 1985, requirements have exceeded production by over 450,000 tU. The difference was covered by inventories and other secondary sources
Historical Uranium Production – FSU and Eastern Europe Kazakhstan accounts for most incremental primary supply globally since 2005.
Recent Uranium Production, tU • Global production increased by a third 2008-2012 • Mines that have opened since 2011 include: • Honeymoon (Australia) • Langer Heinrich Stage 3 (Namibia) • Novokonstantinovskoe (Ukraine) • Willow Creek (US) • Ramp-up of existing mines continues, led by Kazakhstan (nearly 2ktU increased production 2011-2012)
Mining is a risky business! Main risks hampering the development of the biggest U mining projects
Uranium production model assumptions • Five categories of production and potential production capacities: • Current capacities (mines already in operation) • Mines under development (mines for which development decisions have been made and development spending has commenced) • Planned Mines (mines for which a feasibility study has been completed, regulatory process and project financing are advanced, with a definite start-up date) • Prospective Mines (projects which have undergone preliminary feasibility study, regulatory approvals initiated and indicative start-up announced) • Supply Pipeline (uncategorised supply to meet future demand, eg, development of early stage projects, resurrection of cancelled or deferred projects, mine life extensions at existing operations)
Production model discount and delay factors • Three supply scenarios are developed and production capabilities are projected. Production capability for each mine assumes an expected percentage level of the production capacity as well as a ‘delay’ (in years) to start-up
Reference Scenario Primary Supply to 2030, tU • Compared with the 2011 report, expected primary supply has been significantly revised. • Capacity definitions are now more objectively based than in previous report. Many projects have been transferred to the Supply Pipeline category. • Existing capacity incorporates published statements of expected 2030 production (minus approx. 20ktU vs 2011 report) • Planned and prospective capacity changes reflect project cancellations/deferments (eg, Olympic Dam, Trekkopje) (minus approx. 15ktU in 2030 vs 2011 report)
Secondary Supply • Commercial inventories 2012 – 180,000 tU • Utility inventories – 155,000 tU (pipeline material, strategic inventory for security of supply, non strategic – additional) • Uranium producer inventories 10,000 tU • Inventories of other fuel cycle participants 15,000 tU • Government inventories (US 46,000 -56,000 tU, Russia, other) • Fuel banks (US, France, UK, Russia) • Highly enriched uranium (US, Russia) • Recycling • Reprocessed uranium (RepU) • Plutonium – MOX fuel • Re-enrichment of depleted uranium (1,320,000 tU)
Secondary Supply Secondary supply projections do not include commercial inventory changes. Expectations of secondary supply remain high. The 2013 end of the US-Russia HEU Agreement results in nearly 8ktU/yr less supply. Reference Scenario supply in 2030 is about 2ktU less than in the 2011 report. Lower expected US DOE, ERU&MOX, Russian supply is largely offset by greater underfeeding.
Reference Scenario Supply Demand Balance Compared with the 2011 report, uranium requirement projections have fallen. The greater uncertainty in the prospects for nuclear power have greatly impacted expectations of future mine development. On current expectations for existing and future capacity, the market should remain balanced to about 2023. After 2023, the depletion of existing mines and the reduced numbers of expected new mines results in the need for capacity to be developed from the ‘Supply Pipeline’.
Reference Scenario Conversion Supply Demand Balance Capacity is sufficient to meet conversion requirements till 2017. Capacity is assumed in the projection to operate at 70% utilisation. The prospect of capacity shortfalls should incentivise converters to increase utilisation %. In the longer term, new capacity will be required.
Reference Scenario Enrichment Supply Demand Balance • In the short term existing and under-construction capacity plus expected secondary supply is more than sufficient to meet requirements. Adjustment may be achieved by: • Given that centrifuge capacity is modular, current construction plans could be scaled back if desired. • Surplus Russian capacity no longer required for HEU downblendingmay be used for underfeeding. • Potential exists too for underfeeding by Western enrichers.
Fuel Fabrication Supply Demand Balance • In the Western world fabrication capacity currently outweighs requirements by approximately 40%. Existing fuel fabrication capacity is more than sufficient to meet requirements throughout 2020 even for the high case. • Additional capacity can be brought on line faster than additional reactor capacity so the fabrication industry should be able to adjust in a timely fashion.
Conclusions • WNA nuclear capacity projections have been revised downwards since the 2011 report. Nuclear capacity is still projected to increase at a faster rate than anytime since the 1980s to 574GW by 2030 in the reference scenario leading to projected uranium requirements of 97,000tU. • Increased uranium market uncertainty has resulted in the cancellation and deferment of a number of mining projects. Our uranium production methodology has also become more objective. As a result, existing and expected capacity plus secondary supply will be insufficient on current plans to meet reference scenario requirements by about 2024. • Conversion capacity will need to increase utilisation rates after 2017 in the reference scenario in order to meet requirements. • Enrichment capacity will adjust to current surpluses; underfeeding is expected to increase. • Fabrication capacity is expected to be sufficient to meet expected reactor requirements. • Beyond 2030 Generation IV reactors could change future uranium requirements but not to a significant degree before 2050.