Download
1 / 1
30 likes | 247 Views
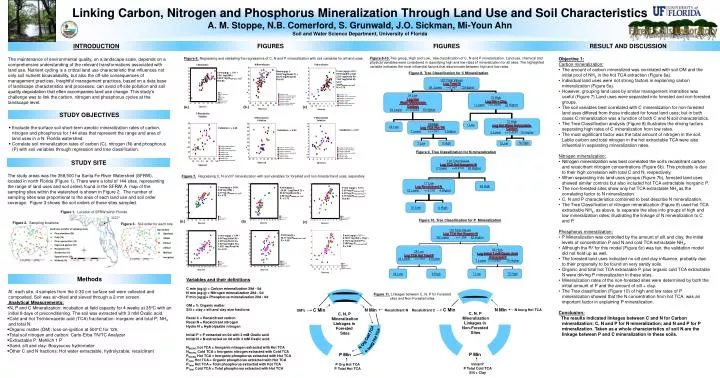
(a.). (b.). (c). Santa Fe River Watershed. Validation r = 0.65. Validation r = 0.37. Validation r = 0.50. Figure 2. Sampling locations. Figure 3. Soil order for each site. Cmin(ug/g) = 1.91 + 0.34* log(OM) + 0.353* log(N INORG hot TCA ) R=0.80.

E N D
(a.) (b.) (c) Santa Fe River Watershed Validation r = 0.65 Validation r = 0.37 Validation r = 0.50 Figure 2. Sampling locations Figure 3. Soil order for each site Cmin(ug/g) = 1.91 + 0.34* log(OM) + 0.353* log(NINORG hot TCA) R=0.80 Figure 6.Regressing and validating the regressions of C, N and P mineralization with soil variables for all land uses. P min (ug/g)= 5.21- 9.52*log(Silt+clay)- 5.35* log(Initial P)+ 7.96* log(Initial N)- 5.33* log(NINORG Cold TCA) R = 0.75 Figure 1. Location of SFRW within Florida Nmin(ug/g) =-28.06*log(Recal C) + 55.72*log(Recal N) R=0.65 N min(ug/g) = 23.71*log (NINORG Hot TCA) R = 0.38 P min (ug/g) = 5.11 – 8.7644* log (Silt + Clay) – 6.172*Log (Initial P) + 2.388*log (PTotal Cold TCA) R = 0.66 C min (ug/g) = 1.44 – 0.34*log (Initial N) – 0.48*log (Recal C)+ 0.22*log (Hydro N) + 1.022* log (Recal N) R = 0.76 Figure 10. Tree Classification for P Mineralization 110 Total Values Log TCA Hot Organic N 28 Lower <=1.386 82 Higher 28 Low Log TCA Hot Total P 24 Lower <=1.501 4 Higher 82 High Log Initial 3 mM Oxalic Acid Extracted P 7 Lower <=-0.0827 75 Higher Figure 11. Linkages between C, N, P for Forested sites and Non-Forested sites. 24 Low 4 High 7 Low 75 High N Inorg Hot TCA Recalcitrant N Recalcitrant C OM% C, N, P Mineralization Linkages in Non-Forested Sites C, N, P Mineralization Linkages in Forested Sites N Org Cold TCA P Inorg Hot TCA Initial P P Total Cold TCA Silt + Clay P Org Hot TCA P Total Hot TCA Linking Carbon, Nitrogen and Phosphorus Mineralization Through Land Use and Soil Characteristics A. M. Stoppe, N.B. Comerford, S. Grunwald, J.O. Sickman, Mi-Youn Ahn Soil and Water Science Department, University of Florida INTRODUCTION FIGURES FIGURES RESULT AND DISCUSSION Figure 8-10. Two group, High and Low, tree classification of C, N and P mineralization. Land use, chemical and physical variables were considered in classifying high and low rates of mineralization for all sites. The highlighted variable indicates the most influential factors that discriminate between high and low rates. • Objective 1: • Carbon mineralization: • The amount of carbon mineralized was correlated with soil OM and the initial pool of NH4 in the hot TCA extraction (Figure 6a). • Individual land uses were not strong factors in explaining carbon mineralization (Figure 6a). • However, grouping land uses by similar management intensities was useful (Figure 7).Land uses were separated into forested and non-forested groups. • The soil variables best correlated with C mineralization for non-forested land uses differed from those indicated for forest land uses; but in both cases C mineralization was a function of both C and N soil characteristics. • The Tree Classification analysis (Figure 8) illustrates the driving factors separating high rates of C mineralization from low rates. • The most significant factor was the total amount of nitrogen in the soil. Labile carbon and total nitrogen in the hot extractable TCA were also influential in separating mineralization rates. • Nitrogen mineralization: • Nitrogen mineralization was best correlated the soil’s recalcitrant carbon and recalcitrant nitrogen concentrations (Figure 6b). This probably is due to their high correlation with total C and N, respectively. • When separating into land uses groups (Figure 7b), forested land uses showed similar controls but also included hot TCA extractable inorganic P. • The non-forested sites show only hot TCA extractableNH4as the correlating factor to N mineralization. • C, N and P characteristics combined to best describe N mineralization. • The Tree Classification of nitrogen mineralization (Figure 9) used hot TCA extractable NH4, as above, to separate the sites into groups of high and low mineralization rates; illustrating the linkage of N mineralization to C and P. • Phosphorus mineralization: • P Mineralization was controlled by the amount of silt and clay, the initial levels of concentration P and N and cold TCA extractable NH4. • Although the R2 for this model (Figure 6c) was fair, the validation model did not hold up as well. • The forested land uses indicated no silt and clay influence, probably due to their propensity to be found on very sandy soils. • Organic and total hot TCA extractable P, plus organic cold TCA extractable N were driving P mineralization in these sites. • Mineralization rates of the non-forested sites were determined by both the initial amount of P and the amount of silt + clay. • The Tree classification (Figure 10) of high and low rates of P mineralization showed that the N concentration from hot TCA, was an important factor in explaining P mineralization. • Conclusion: • The results indicated linkages between C and N for Carbon mineralization; C, N and P for N mineralization; and N and P for P mineralization. Taken as a whole characteristics of soil N are the linkage between P and C mineralization in these soils. The maintenance of environmental quality, on a landscape scale, depends on a comprehensive understanding of the relevant transformations associated with land use. Nutrient cycling is a critical land use characteristic that influences not only soil nutrient bioavailability, but also the off-site consequences of management practices. Insightful management practices, based on a data base of landscape characteristics and processes, can avoid off-site pollution and soil quality degradation that often accompanies land use change. This study’s challenge was to link the carbon, nitrogen and phosphorus cycles at the landscape level. Figure 8. Tree Classification for C Mineralization STUDY OBJECTIVES • Evaluate the surface soil short-term aerobic mineralization rates of carbon, nitrogen and phosphorus for 144 sites that represent the range and area of land uses in a N. Florida watershed. • Correlate soil mineralization rates of carbon (C), nitrogen (N) and phosphorus (P) with soil variables through regression and tree classification. STUDY SITE The study areas was the 358,500 ha Santa Fe River Watershed (SFRW), located in north Florida (Figure 1). There were a total of 144 sites, representing the range of land uses and soil orders found in the SFRW. A map of the sampling sites within the watershed is shown in Figure 2. The number of sampling sites was proportional to the area of each land use and soil order coverage. Figure 3 shows the soil orders of those sites sampled. Figure 7.Regressing C, N and P mineralization with soil variables for forested and non-forested land uses, separately. C min(ug/g) = 2.00+ 0.52*log (OM) + 0.21*log (NINORG Hot TCA) R = 0.78 N min(ug/g) = -23.55 * Log(Recal C) + 50.42*log(Recal N) + 4.93*log (PINORG Hot TCA) R = 0.72 P min (ug/g) = 6.75 + 2.34*log (PORG Hot TCA) – 3.33*log (PTotal Hot TCA) – 3.75*log (NORG Cold TCA) R=0.64 (a.) (b) (c) Methods Variables and their definitions C min (ug/g) = Carbon mineralization 29d - 0d N min (ug/g) = Nitrogen mineralization 29d - 0d P min (ug/g)= Phosphorus mineralization 29d - 0d OM = % Organic matter Silt + clay = silt and clay size fractions Recal C = Recalcitrant carbon Recal N = Recalcitrant nitrogen Hydro N = Hydrolyzable nitrogen Initial P = P extracted on 0d with 3 mM Oxalic acid Initial N = N extracted on 0d with 3 mM Oxalic acid NINORG hot TCA = Inorganic nitrogen extracted with Hot TCA NINORG Cold TCA = Inorganic nitrogen extracted with Cold TCA PINORG Hot TCA = Inorganic phosphorus extracted with Hot TCA PORG Hot TCA = Organic phosphorus extracted with Hot TCA PTotal Hot TCA = Total phosphorus extracted with Hot TCA PTotal Cold TCA = Total phosphorus extracted with Hot TCA • At each site, 4 samples from the 0-30 cm surface soil were collected and composited. Soil was air-dried and sieved through a 2-mm screen. • Analytical Measurements: • N, P and C Mineralization: incubation at field capacity for 4 weeks at 35oC with an initial 8 days of preconditioning. The soil was extracted with 3 mM Oxalic acid. • Cold and hot Trichloroacetic acid (TCA) fractionation: inorganic and total P; NH4 and total N; • Organic matter (OM): loss-on-ignition at 500oC for 12h. • Total soil nitrogen and carbon: Carlo-Erba TN/TC Analyzer • Extractable P: Mehlich 1 P • Sand, silt and clay: Bouyoucos hydrometer • Other C and N fractions: Hot water extractable, hydrolyzable, recalcitrant