Download
1 / 25
250 likes | 416 Views
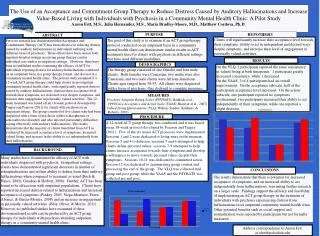
Geospatial Demographics. Use of Geospatial Demographics in College Recruitment Planning. Shonda Kuiper & Tom Moore. Lin Ji & Demetrio Rojas. An Introduction to Geospatial Demographics and Statistics.

E N D
Geospatial Demographics Use of Geospatial Demographics in College Recruitment Planning Shonda Kuiper & Tom Moore Lin Ji & Demetrio Rojas
An Introduction to Geospatial Demographics and Statistics • Geospatial demographics are the demographics pertaining to the geographic location of natural or constructed features on, above, or below the earth's surface; • The emergence of GIS (Geographic Information Systems) provides a visual interpretation of geographical data. • With advances in theoretical statistical analysis and GIS, people are just starting to take advantage of this field. Population censuses, soil conditions and even weather predictions are now based on Geospatial statistics.
Why Geospatial Demographics are important to Grinnell College • Knowledge on its prospective and possible prospective students is essential to Grinnell College • By identifying geographical characteristics of particular regions, we can recognize regional traits that are highly correlated with students’ level of interests in and qualification to attend Grinnell College (Inquiries, Complete Apps, Admits and Net Paids). • Efficient recruitment programs could be devised by pin-pointing the location of strong student markets for Grinnell • We can use the correlation mentioned above (point two) to make predictions on counties and High Schools (HS) that currently show no interest.
GOALS • Collect appropriate Geospatial data and combine it with students’ individual record (both at the county and high-school level) • Identify the spatial relationships between geographical and socioeconomic data and the number of Inquiries (INQ), Complete Application (APPS), Admitted Students (ADM) and Net Paids (NP) that Grinnell college has received between 1998 and 2005 • Use Stepwise Regression, Analysis of Variance and Multivariate Regression to develop appropriate mathematical models that can be used to predict national trends in students interest in Grinnell • Create a measure of the accuracy of these models • Make prediction for potential success on counties and high schools where students haven’t demonstrated interest in Grinnell in the past years
Overview of Our Data Grinnell College Student Record • Provided by the Office of Institutional Research • It is a record of each and every student that has contacted Grinnell College. This contacts range from inquiries to net paid • Data consists of: • Individual SAT and/or ACT scores • minority status • academic interests • extra-curricular interests • home-town • School • visit (y/n) • … and much more High school Data Set • From the Collegeboard and Grinnell College • Data consists of: • number of students • number of graduates • post-graduation plans • HS Address and names • standardized test scores • number of AP Courses offered • neighboring schools • distance from Grinnell College • … and much more CONTINUED….
County Data Set • Provided largely by Grinnell College from the US Census of the year 2000 and a company called DUSA. The political information was derived from the 2004 presidential elections from USA Today and the religion data is from The American Religion Data Archive. • Data consists of: • population • pop/sq mile • Ethnicities • household income (separated into 4 brackets) • employment (blue collar, white collar, finance, services) • expenditures (books, clothing, food, medical) • Regional divisions • % of college graduates • number of adherent to each main religion (Catholic, Evangelical) • … and much more Data Manipulations • Individual HS data was summed up (number of HS students) or averaged (SAT scores, AP courses offered) tothe county level. • All HS in the same county were assigned identical county values. • Irrelevant data (foreign HS, or HS that reported no students), and unusual data (ACT score >36) were not included in our final analysis. • Categorical variables were also used. E.g: for regional divisions (west (y/n) numerical characters were given to each category. Yes=1, No = 0 • Most counts were transformed into percentages in order to control for areas of high pop. and therefore much higher counts than areas of low pop.
Methodology for Identifying Spatial Relationships • The College Student Record provided us with response variables, such as inquiries (INQ), complete apps (APPS), Admits (ADM) and Net Paids (NP). • To these four then we made 11 transformation such as NP/ADM, NP/INQ, and Overall Interest = INQ+APPS+ADM+ NP, in order to identify success rates and create an overall interest measure. • Used stepwise regression to identify the most accurate models • We tested multivariate regression models suggested by stepwise-regression for each response variable at the county and HS level
Things to know before getting into regression • High n (Number of Rows (HS, or Counties used)) • Low K (number of predictors) • R^2 (Explained Portion) • Difference between linear and multivariate regression Mean
Stepwise Regression • We have 150 possible predictors and we would like to reduce the number of predictors and still yield an accurate prediction. Stepwise regression is a technique that selects the best predictors to include in a multiple regression model. • Forward stepwise regression starts with no terms in the model. At each step it adds the most statistically significant term until there are none left. We chose an α-level to enter of 0.02 which means that the model is 98% confident that the last variable does indeed have an impact on student interest before it is entered into the model. • Backward stepwise regression starts with all the terms in the model and removes the least significant terms until all the remaining terms are statistically significant. We chose an α-level to remove of 0.15.
Measuring the Accuracy of these models • Higher R2 values indicate a more accurate model. • Based on input from Institutional Research and highest R2 values we stuck to our initial four variables and one new transformations: Overall Interest = INQ+APPS+ADM+NP • Isolating regional models (Northeast, South, Midwest and West) provided us with more accurate predictions than aggregating the entire country into one model.
Regional Differences Stepwise regression identified the following variables to predict student inquiries: Inquiries-Northeast:total number of adherents of main religious groups, household with income between 75k and 150k, % of household composed by only one male, population per square mile (in 2000), number of students taking standardized tests, total graduates (2000), average SAT verbal score, % of votes for Nader (2004), % of household with one male and children Inquiries-Midwest: total number of adherents of main religious groups, % of Asian, projected number of people per household, population in 2000, total mainline adherents, projected population for 2005, number of students taking standardized tests, % of vacant households, % of employment in finance, % of Asian in HS Inquiries-West: population in 2000, projected population for 2005, % of pop with a college degree, total number of adherents of main religious groups, number of students taking standardized tests Inquiries-South: total number of adherents of main religious groups, % of Asian, Rurality of the county, number of students taking standardized tests, % of household with income between 25k and 74k, average size of a household, Avg number of advanced courses offered at HS (AP+IB+ honors), % of pop with a college degree, % of employment in finance, projected number of person per household for 2005, average SAT verbal score Notice that there are several similarities between the variables in each region however their impact varied from region to region.
Increase in Accuracy for the Regional Model HIGH SCHOOL COUNTY
Counties of the United States • Collect appropriate Geospatial data (both at the county and high-school level) • Identify the spatial relationships • Develop appropriate mathematical models to predict national trends in students interest • Create a measure of the accuracy of these models
Predicted Overall Interest Measure Make prediction for potential success on counties and high schools How accurate were our predictions?
Overall Interest Measure Predicted Residuals Actual
Actual, Predicted and Residual Maps for INQ (HS) Actual Residual Predicted
Where to go now • Our project was based on building theoretical models to predict national trends in student application to Grinnell College. How do we make this applicable to the office of IR? • Provide existing data and graphs: • INQ, NP predictions for each county and high school • Identifying return rates (NP/INQ) • Identifying which variables have the biggest impact on student interest levels • Find “high potential” areas to focus recruitment efforts • Creating a better overall interest measure • Incorporate appropriate usage of GIS in the development of recruitment strategies
Where to go now • Incorporate Variance Stabilizing Transformation (such as log for population) to provide even better R^2 values • Look at residual plots for patterns which suggest additional transformations • Analyze interactions among variables such as Political and religious data, and distance and rurality measures • Utilizing Principal Component analysis to develop a composite result response variable • Transform Responses to a percentage of population density (more useful to Office of Institutional Research) • Restrict model development to each row (County or HS) where Inquiries are > 20 • Test for influential points that affect the regression model by causing R2 to increase or decrease substantially