1 / 1

Supplementary figure 1

Supplementary figure 1. Viable. Viable. Apoptotic. Apoptotic. Necrotic. Necrotic. 120. SKOV-3. 100. 80. 60. % total number of cells. 40. 20. 0. 0 hr. 24 hr. 48 hr. 72 hr. 96 hr. - 22 kDa. WB:. - 15 kDa. α Bid α G3PDH. - 37 kDa. Caov-4. SKOV-3. A. 120. Caov-4. 100.

ella
Download Presentation

Supplementary figure 1

An Image/Link below is provided (as is) to download presentation Download Policy: Content on the Website is provided to you AS IS for your information and personal use and may not be sold / licensed / shared on other websites without getting consent from its author. Content is provided to you AS IS for your information and personal use only. Download presentation by click this link. While downloading, if for some reason you are not able to download a presentation, the publisher may have deleted the file from their server. During download, if you can't get a presentation, the file might be deleted by the publisher.

E N D

Presentation Transcript


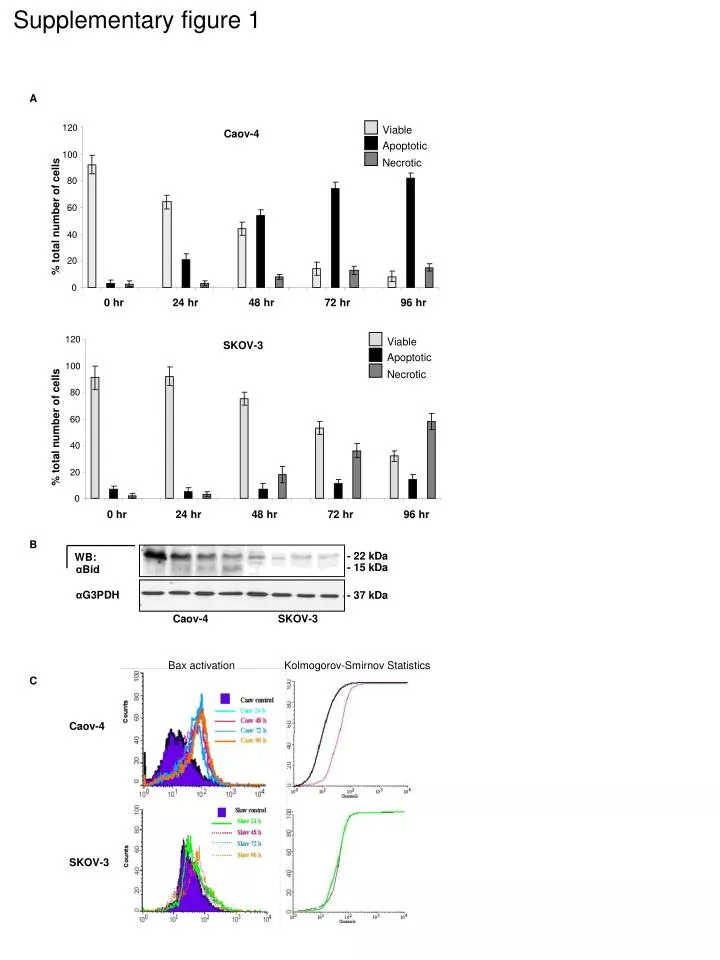
  1. Supplementary figure 1 Viable Viable Apoptotic Apoptotic Necrotic Necrotic 120 SKOV-3 100 80 60 % total number of cells 40 20 0 0 hr 24 hr 48 hr 72 hr 96 hr - 22 kDa WB: - 15 kDa αBid αG3PDH - 37 kDa Caov-4 SKOV-3 A 120 Caov-4 100 80 60 % total number of cells 40 20 0 0 hr 24 hr 48 hr 72 hr 96 hr B Bax activation Kolmogorov-Smirnov Statistics C Caov-4 SKOV-3

More Related