Download
1 / 51
510 likes | 611 Views
Planning Data Requirements and Profile. Planning RSTWG Meeting May 24 10-12:30 pm. Planning RSTWG Topics. Document Organization Typology Outline Difference between Data Concepts & Data Summaries Planning Data Concepts Service Supplied Service Consumed Accessibility Comparison

E N D
Planning Data Requirements and Profile Planning RSTWG Meeting May 24 10-12:30 pm
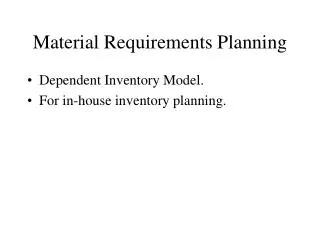
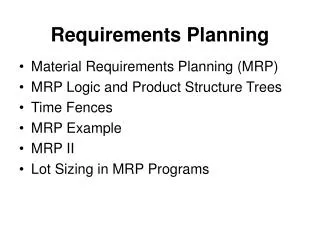
Planning RSTWG Topics • Document Organization • Typology • Outline • Difference between Data Concepts & Data Summaries • Planning Data Concepts • Service Supplied • Service Consumed • Accessibility • Comparison • Cross Cutting Concepts • Transit Network • Time Period • Validity checking, metadata, conformance and more
Document Organization PDP Data Requirements Document 1st Draft Published: April 30 (5 May) 2010
PDP Requirements Document • Introduction • Planning and Data Overview • Cross-cutting Selection Concepts • Transit Network: Query by geographic units • Time Period: Query by temporal units • Detailed Planning Data Concepts • Service Supplied • Service Consumed • Accessibility • Dataset Comparison
PDP Requirements Document, cont. • Validity Checking • Metadata • Conformance • Schema, versioning, naming conventions, integration with other TSIP Data Profiles • Appendices • Data Dictionary (glossary and acronym list) • References / Resources • Parking Facility Data Model • Transit Vehicle Extensions • Accessibility Extensions • NYMTC PDP “profile” • List of Data Sets
Summary Data Set Format Summary Data Set is the output (Result Set) of a query. The Query is included in the Result Set
Service Information Categories • Service Supplied (Section 4.1) • Service Consumed (Section 4.2) • Accessibility (Section 4.3) • Level of Service (TBD) • Fares (part of Fare Collection Data Requirements)
Transit Network How the query for location works…
Querying for Transit Network When you know the features you are looking for, you can enter query here.
Service Supplied Planned service information includes schedule, route and schedule calendar information.
Service Supplied • ..describes service provided to meet needs of current and future customers, and used to measure effectiveness of service plans that are translated into deliverable service. • Uses schedule and other planned service data (defined in SDP)
Create Data Sets to Calculate Planning Measures from Schedules • Key Summary Data Sets: • Mode • Average Running Time (scheduled) • Headway / Frequency • Service Type • Span of Service • Capacity (vehicle and infrastructure) • Transfer Opportunities (coordinated service) • Planned Exceptions (revisions to original schedule)
Additional SDP Data Concepts • (1) Service Type • Add to Trip element. • (2) Public Transit Vehicle (PTV) -- Rail and Bus • to support vehicle capacity measure.
Result Set -- Mode for Route, Trips, Transit Facilities • From SDP (derived from NTD), for example: • CR = commuter rail • FB = ferry boat • HR = heavy rail or subway • MB = bus (motor bus) • CO = coach bus (e.g., commuter bus)
Running Time Data Concepts • Average Running Time • The duration (in seconds) needed for a public transportation vehicle in revenue service to travel between a known location to another over the same path. For example, for one or more trips (over the same path), the running time is the average time it takes to travel between each trip’s locationBegin to locationEnd, or between one TripTime to another. • Service Type [serviceType] • A classification for the level of service provided by a trip. • Regular, express, circular, jitney, limited, etc.
Average Running Time • Where “t” indicates the time in seconds at the starting and ending locations (origin and destination, respectively) and “n” indicates the number of trips included in the calculation.
See Avg Running Time Equation segmentID indicates either a patternID or tranPathID Result Set -- for Running Time on Trips (Pattern) or Route Segment
Effective Headway • Effective Headway: Composite headway of all bus, rail or other mode service at a stop or in a corridor based on vehicle frequency, the number of vehicles per hour divided by 60 minutes. • In other words, the effective headway is the number of minutes between transit vehicles when all headways are combined. Effective Headway is typically calculated by an individual mode along a route, but a combination of modes may be used at a key stop. • Where “SH” refers to the service headway and “n” refers to the number of service headways that are included in the calculation for the effective headway.
Effective Headway Example • Example #1: two routes operating on a segment of roadway (or track) each with ten minute headways, the effective headway is five minutes. Effective headway = 60 / (60/10 +60/10) = 5 minutes • Example #2: when calculating effective headway for the stop at E 116 Street and 3rd Avenue where service is provided by the Routes 98, 101, and 103 with service headways of 10, 7 and 5 minutes (respectively), then the effective headway would be: Effective headway = 60 /[(60 minutes / 10 minute headway) + (60 minutes / 7 minute headway) + (60 minutes / 5 minute headway)] = 60 minutes / 26.6 buses hour = 2.25 minutes
Result Set -- for Eff. Headway for Rte Segments and Transit Facilities
Result Set -- for Service Type for Trips, Rte Seg, Facilities • Service type examples: • Regular • Express • Limited • Circular • Jitney • Should BRT be Mode or ServiceType?
Result set for Request for Span of Service for Trips, Rte Seg, Facility • Duration of service for an agency, along a corridor, on a particular route, or at a transit facility Example: serviceSpan = 5:58 pm to 10:32 am = 990 min
Vehicle Passenger Capacity (supply side measure) • Capacity is the measure of total number of passengers (that can be supplied by a transit vehicle) per hour by pattern, corridor, or through a transit passenger facility. • The Capacity Data Set is the summation of vehicle passenger capacity assigned to each trip that traverses the geographic dimension over a time period (e.g., 1 hour). The capacity data set includes capacity measures for: • Total (seating+standing) • Seating • Standing • Wheel chair Needed to augment the Transit Vehicle Definition to support vehicle capacity measures including rail cars in each consist.
Result set for Request for Capacity for Trips, Rte Segment, Facility
Result Set for Request for Transfer Service for Trips • Coordination between trips within an agency • Coordination between trips between two agencies • Related SDP Data Concepts • “Places and times when connections may be made…These concepts differ from geographically and temporally calculated trip connections in that they are recommended transfer locations and times.” [SDP Guidance Part 2, 10-1] • Event Connection [connection types include protected, recommended, scheduled] • Transfer Cluster [may include Connection Segment]
Transfer Concepts in SDP Abridged Version
Result Set for Request for Transfer Service for Transit Facilities
Result Set -- for Planned Exception data • Planned Exception data set includes revisions to an original schedule. • Request scheduleVersionID • Example LI Bus: 210, 110, 409, 309, 209
Service Consumed • Service Consumed are those transit provisions -- related to services and facilities -- that are used by transit passengers as part of revenue service. • Key Data Concepts • Boardings / Alightings at stops (locationID) • Passenger Load by route segment • Key Summary Data Sets • Average Load • Average Ridership (at stop)
Passenger Count Data Concept • Passenger Load and Ridership • Calculated from CountList Structure Boardings (onCount) and Alightings (offCount). • thruCount* • Used to capture the number of passengers who stay on an interlining vehicle. • wcOnCount, wcOffCount and wcThruCount • Used to capture wheelchair ridership. • cumulativeOn / Off • Captures the boarding and alighting from the start of each trip. • A simple load may be calculated for a route segment by the difference bet. the cumulative Ons and Offs. * “thru” count idea from TCRP Report 113: Using Archived AVL-APC Data…
Passenger Ridership Calculations • Algorithms for average alightings, wheel chair boardings, and alightings are similarly calculated by substituting offCount, wcOnCount, and wcOffCount for onCount.
Passenger Load Calculations • Average Load Calculation for Multiple Trips • Average Load Calculation for Multiple Route Segments in a Corridor
Average Load Data Set Load is calculated differently for Routes (trips) vs. Corridors (route segments)
Average Load Example * Trips are of the same Route and Pattern
Accessibility Defn & Data Req’ts • “The ease of mobility and maneuverability (e.g., time, distance and transfers required) for a person to get from point A to point B using transit.” • Refined defn for SDP – adaCompliance_cd • notCompliant • fullyCompliant • mobilityChallengedAccess • visuallyChallengedAcess • …
Accessibility • Key Data Concepts • Vehicle Equipment • Wheelchair lifts, ramps, signs, announcements, other equipment for rail, subway and bus • Station • Platform • Access (gap, drop); equipment to bridge gap • Announcement and Signs • Frequency, Volume/Brightness, type, location of Braille signs • Accessible paths • Transfers • Access to stations/stops (incl. entrances, pads, and bet parking and stop/platform)
Extension to Connection Segment • Added connectionType to Connection Segment. • Values include: • fullMobility • partMobility • fullAccessibility • partAccessible • notAccessible partMobility: “may include curbs, escalators, and other small obstructions..” partAccessible: “may not include announcements and signs..”
Extension to Amenity Passenger Access Component and Amenity • Designates Amenity (shelter, bench, TVM) as “access-enabled” through adaCompliance. • Add PAC_Characteristics with attributes associated with one or more PACs.
Extension to Transit Vehicle with Access Attributes • Added adaCompliance & accessEquipment • Added AccessibilityStatus (description of accessibility for each rail car, bus and other PTV)
Next Steps • Incorporate Changes and Updates • Add more examples • Assignments/Selection: • Running Time for Trips on a Pattern • Running Time for Corridor • Service Headway • Frequency • Effective Headway for Transit Facility • Service Type (need raw data…) • Span of Service • Transfer Service (Metro North for Trips) • Planned Exceptions (need raw data…) • Ridership / Load (need raw passenger count data…) • Accessibility (need attribute data on vehicles, stations, connection paths)