Download
1 / 29
290 likes | 293 Views
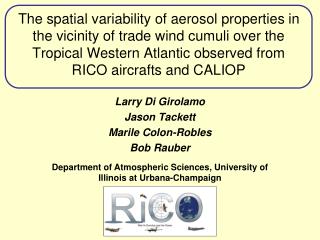
The spatial variability of aerosol properties in the vicinity of trade wind cumuli over the Tropical Western Atlantic observed from RICO aircrafts and CALIOP. Larry Di Girolamo Jason Tackett Marile Colon-Robles Bob Rauber.

E N D
The spatial variability of aerosol properties in the vicinity of trade wind cumuli over the Tropical Western Atlantic observed from RICO aircrafts and CALIOP Larry Di Girolamo Jason Tackett Marile Colon-Robles Bob Rauber Department of Atmospheric Sciences, University of Illinois at Urbana-Champaign
Motivation Aerosols modify cloud properties through a variety of “indirect effects.” Courtesy of S. Tripathi Many modeling studies into aerosol indirect effects usually prescribe horizontally homogeneous aerosol properties
Motivation Clouds modify aerosol properties through a variety of chemical and dynamical processes. The cloud processing and detrainment of aerosols, coupled with humidity haloes, implies that aerosol properties in the near-cloud environment are different than the far cloud environment. Where’s the observations? Cloud processing Adapted from Hegg (2001)
Where’s the observations? • Passive satellite sensors have been hampered by 3-D radiative cloud-adjacency effects (e.g. Wen et al. (2007), Yang and Di Girolamo (2008)). • Aircraft in situ observations have been hampered by inadequate sampling lengths to provide “near-cloud” aerosol spectra. • Sun-photometers are also subjected 3-D radiative cloud-adjacency effects… but Koren et al. (2007) and Redemann et al. (2009) both observed an AOD increase of ~10 – 13% near cloud. • Lidar are also hampered by 3-D radiative cloud-adjacency effects when operated during the day… but Su et al. (2008) observed an AOD increase of ~ 8 – 17% near cloud using the HSRL. Tackett and Di Girolamo (GRL 2009 submitted) using CALIPSO
The CALIOP Instrument CALIOP : Cloud Aerosol LIdar with Orthogonal Polarization Backscatter :Fraction of radiance scattered in backward direction (km-1sr-1) Wavelengths λ = 532 nm and 1064 nm Resolution Horizontal: 333 m Vertical: 30 m (λ = 532 nm) 60 m (λ = 1064 nm) http://www-calipso.larc.nasa.gov/
CALIOP Data Products Total Attenuated Backscatter (km-1sr-1) = radius = complex index of refraction = total number concentration = lidar wavelength = size distribution = scattering efficiency = scattering phase function = two-way transmittance Typical values: (km-1sr-1) Aerosols: 10-3 to 10-2……..Clouds: 0.1 to 1
CALIOP Data Products Color Ratio Color ratio Typical values: Clouds: ~1.0 Aerosols: 0.4 – 0.8 Backscatter at 532 nm (km-1sr-1) Vaughan et al. (2005)
CALIOP Data Products b’532, b’1064, c’ (1/3 km) Cloud Layer Product for cloud masking (1/3 and 5 km) CALIOP Aerosol Product (5 km) is NOT used
Region & Time of Interest Focus is on the Caribbean in winter RICO Field Campaign ~2700 km RICO: Rain In Cumulus over the Ocean ~2100 km Dec. 2004 – Jan. 2005 ~3000 km Focus on nighttime data over ocean Courtesy of Google Earth
Methodology Criteria: • Clouds between 0.5-2.0 km • Single layered • No clouds above ‘clear air’ profile • Horizontal distance to next cloud ≥ 3 km Altitude
Methodology Store β': Satellite direction • From cloud top to cloud base altitudes • To ½ the distance to the next cloud 333 m 30 m Altitude Total meeting criteria: 26,833 clouds 34,371 cloud edges β' Dist. from cloud Dec. ’06 – Feb. ’07 & Dec. ’07 – Feb. ’08 Dec. ’08 – Feb. ’09
Methodology Averaging strategy Altitude Altitude ½ dist. to cloud Distance to cloud edge Number of samples: 1 2 3
Methodology Averaging strategy Altitude Altitude Distance to cloud edge Number of samples: 1 2 3
Methodology Averaging strategy Altitude Altitude Distance to cloud edge Number of samples: 1 2 3
Median backscatter λ= 532 nm
Normalized median backscatter λ= 532 nm
Theory vs. observations When comparing 3 km from cloud edge to ~0.3 km to cloud edge… Observations How to explain? What changes in aerosol properties can account for this?
Theory vs. observations Log-normal Size distribution [Hess et al, 1998]: Parameters: Rj = median radius σj= standard deviation Nj= number concentration Composition [Peter et al, 2008]: r ≤ 0.2 μm, ammonium sulfate r > 0.2 μm, sea salt Far From Cloud Aerosol Distribution Relative Humidity = 80%
Theory vs. observations est fit to observations: ΔRj = 34% Δσj= −2% ΔNj = −32% ΔAOD532 = 16%
Prelim Observations from RICO 100 – 200 m vs 1000 – 1100 m based on all RICO flights PCASP FSSP
Prelim Observations from RICO 100 – 200 m vs 1000 – 1100 m
Potential Processes Best fit to observations: ΔRj = 34%, Δσj = −2%, ΔNj = −32% • Hygroscopic growth: Increases Rjandσj, leaving Nj unchanged • Collision-coalescence: Increases Rjandσj,decreases Nj • Precipitation scavenging: Decreases Rj,σj, and Nj • Other scavenging processes (nucleation, diffusion, impaction): Increases Rjandσj, decreases Nj No single process dominates based on observations
Theory vs. observations Cloud contamination Cloud contamination alone cannot explain the observations
Integrated median backscatter Day vs Night
Conclusion How does lidar backscatter in the vicinity of clouds compare to far from clouds? • Systematic increase in backscatter near cloud edge • Layer integrated backscatter increased by ~31% at λ = 532 nm and ~42% at λ = 1064 nm • Layer averaged color ratio increased by ~15% • Greatest enhancement at cloud base and top • An increase in aerosol sizes and a decrease in number concentration near cloud edge best explains the observations (ongoing RICO aircraft analysis) • The method and results are amenable for evaluating models Tackett and Di Girolamo (GRL submitted)