Download
1 / 25
250 likes | 253 Views
Energy, Networks, Electronics, Data Centers, …… Bruce Nordman Lawrence Berkeley National Laboratory October 17, 2007 BNordman@LBL.gov — efficientnetworks.LBL.gov 510-486-7089. Topics. Electronics Energy Use Servers SPEC, EPA Report to Congress PCs Proxying, Energy Star

E N D
Energy, Networks, Electronics,Data Centers, …… Bruce Nordman Lawrence Berkeley National Laboratory October 17, 2007 BNordman@LBL.gov — efficientnetworks.LBL.gov 510-486-7089
Topics • Electronics Energy Use • Servers SPEC, EPA Report to Congress • PCs Proxying, Energy Star • Displays, printers, … Energy Star • Consumer electronics Networking, power controls • Network equipment All sizes; protocols; links • User interfaces IEEE 1621 standard • Networking of non-electronicbuilding energy loads ~20 years future; start stds now • lighting, climate control, …
How much energy does the Internet use? 1999 “At least 100 million nodes on the Internet, … add up to … 8% of total U.S. demand. … It's now reasonable to project that half of the electric grid will be powering the digital- Internet economy within the next decade.”emphasis added 2007
How much energy doesnetwork equipment consume? • All of these figures rough estimates for 2006 • None of this includes cooling or UPS • $0.10/kWh used for convenience
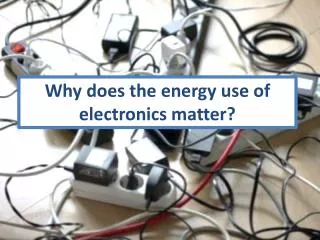
How about All Electronics? • PCs/etc., consumer electronics, telephony • Residential, commercial, industrial • 250 TWh/year • About 7% of U.S. total electricity • Well over $20 billion/year • Over 180 million tonsof CO2 per year • Roughly equivalent to 30 million cars! Numbers represent U.S. only One central baseload power plant (about 7 TWh/year) PCs etc. are digitally networked now — Consumer Electronics (CE) will be soon
Networks and Energy Product Network Int. Network Product Network equipment …. Modems, routers, switches, wireless APs, … … vs networked equipment PCs, printers, set-top boxes, … How networks drive energy use • Direct • Network interfaces (NICs) • Network products • Induced in Networked products • Increased power levels • Increased time in higher power modes
Network Structure Source: Tucker et al., 2007 Core Metro and Edge Access Access Access Access
Power Consumption of IP Network (Residential portion only) Source: Tucker et al., 2007 ~ 1% of Electricity Supply (OECD average) Total 1.5 30 Dominated by Access Metro + Access 1 20 Power (MW/106 Users) % of Electricity Supply 0.5 10 Core SDH/WDM Links 0 0 0 40 80 20 60 100 Average Access Rate (Mb/s)
How should we think aboutnetworks and energy? Approaches / Focus • Device • AC*-powered products • Link • Capacity, usage, distance, technology • Throughput • Traffic totals, patterns, distribution • Application / Protocol • Drivers of infrastructure, nodes Essential to use all approaches simultaneously
Data • Need to ground energy / network research in real data • Clarifies drivers of energy use • Often reveals savings opportunities • Following slides show examples of such data • Much more needed
Power Consumption Trends 15 10 Cisco CRS-1 (16-slot) Power Consumption (kW) Juniper T640 Cisco CRS-1 (4-slot) Cisco CRS-1 (8-slot) 5 Alcatel-Lucent (14-slot) Juniper T320 2x capacity = 1.75x power Alcatel-Lucent (7-slot) 1 100 300 500 700 900 Capacity (Gb/s) Source: Tucker et al., 2007
Power Consumption Trends Source: METI, 2006 Routers 100000 10000 Power consumption (W) 1000 100 10 1 0.1 1 10 100 1000 10000 100000 1000000 10000000 Maximum throughput (Mbit/s)
Sample utilization graphs • Snapshot of a typical 100 Mb Ethernet link • Shows time versus utilization (trace from Portland State Univ.)(Singh) Typical bursty usage (utilization = 1.0 %) • File server link utilization (daytime) (Bennett, 2006)
Utilization • Data networks are lightly utilized, and will stay that way, A. M. Odlyzko, Review of Network Economics, 2003 Network Utilization AT&T switched voice 33% Internet backbones 15% Private line networks 3~5% LANs 1% Energy cost is a function capacity, not throughput
NIC / Link Power Measurements — all incremental AC power • Typical switch with 24 ports 10 / 100 / 1000 Mb/s • Various computer NICs averaged Source: Christensen, 2005
Adaptive Link Rate — Energy Efficient Ethernet • Concept • Add power management to Ethernet • Method • Reduce link rate at times of low traffic levels • Most time on most links is low traffic levels • Quick transitions and seamless operation essential • Energy Savings • In network interface hardware and rest of system • In homes, commercial buildings, and data centers • U.S. direct savings — $ several hundred million/year • Status • IEEE 802.3az Task Force approved in September • Hardware should be available in several years • LBNL role • Initiate project, chair committee, link toenergy efficiency community
Efficiency Approaches Product Focus Network Product Focus Interface Focus Protocol Focus Need all approaches
Some Research Needs • Modulating capacity to need • Using latency requirements to discriminate • Selectively-connected network architecture (NSF-FIND — Paxson et al.) • Wireless • How to integrate small devices into Internet
HR 5646 — Data Center IT Equipment • “The energy used by the nation’s servers and data centers …is estimated that … consumed about 61 billion kilowatt-hours (kWh) in 2006 (1.5 percent of total U.S. electricity consumption) for a total electricity cost of about $4.5 billion.” • Power/cooling infrastructure = IT load • IT load is split: • 70% Servers • 20% External Storage • 10% Network Note: Not all network equipment - telecom, wiring closet, ISP, ….
Modulating Power to Match Compute Load • Concept and real data showing how server power drops with computing load • Test procedures neededto gather such data fornetwork equipment Source: Nordman, 2005
PC Energy Use All time for year sorted by power level Most of time when idle, could be asleep PC savings potential is most of current consumption Similar patterns apply to set-top boxes for TVs
Proxying • Concept • Allow sleeping PCs to remain fully network connected • Method • Define standard for how network interface can maintain “full network presence” • Energy Savings • Likely < 1 W extra for proxy hardware • Avoids > 50 W for PC being on • U.S. direct savings — Easily > $1 billion/year • Status • Working with industry to draft content of proxying standard • LBNL role • Initiate project, coordinate with academia, industry, standards organizations, energy community
Key issues for Proxying • Networked devices must be able to maintain: Access to the physical link Host IP address Host reachability Membership in a multicast group Secure communications Ability to be remotely manageable Ability to be remotely testable Ability to connect to sleeping network applications Client/server and peer-to-peer application-level semantics • States / Transitions • Proxying at Layer 3: • DHCP , ARP ,IGMP IPSec ,SNMP, ICMP (Ping) • Proxying at Layer 4: • Maintain TCP connections
How Proxying Works Proxy 3 2 4 LAN or Internet 1 Sleeping PC Proxy operation 1 PC awake; becomes idle PC transfers network presence to proxy on going to sleep Proxy responds to routine network traffic for sleeping PC Proxy wakes up PC as needed 2 3 4 Proxy can be internal (NIC) or external (in other PC, switch or router, wireless base station, or dedicated device)
Summary No summary -- on to discussion! efficientnetworks.LBL.gov Bruce Nordman Lawrence Berkeley National Laboratory BNordman@LBL.gov 510-486-7089 (m: 510-717-2916)