Download
1 / 14
140 likes | 272 Views
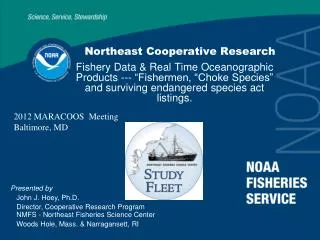
Northeast Cooperative Research. Fishery Dependent Data: Observer and Study Fleet programs. Presented by John J. Hoey , Ph.D. Director, Cooperative Research Program NMFS - Northeast Fisheries Science Center Woods Hole, Mass. & Narragansett, RI.

E N D
Northeast Cooperative Research Fishery Dependent Data: Observer and Study Fleet programs • Presented by • John J. Hoey, Ph.D. • Director, Cooperative Research Program NMFS - Northeast Fisheries Science Center • Woods Hole, Mass. & Narragansett, RI
Annual trip and haul observation totals for Observer and Study Fleet fishery dependent data 2011 Observer data – NEFOP thru August – ASM preliminary Sept - Dec
OBSERVER EFFORTS 2007-2011 N=81,030 SF EFFORTS 2007-2011 N=28,984
NE Study Fleet - Post-processing of GPS and temperature-depth data = x • By combining the GPS polling data with the TD probe data we can determine the location and timing of fishing effort from which the time-of-day, haul duration, haul location, distance fished, haul depth and water temperature can be determined.
Mean Bottom Temp & Depth for trawl tows monitored at 90 sec intervals
A COMPARISON OF STUDY FLEET (SF) AND NEFOP/ASM OBSERVER COVERAGE IN COASTAL STATISTICAL AREA: 2008-Present
Thoughts for consideration • Accuracy in terms of time and location provide leveraging opportunities for ecosystem data (tides, lunar cycles, etc.) which can improve the utility of maps and may better reflect fishermen’s local ecological - operational knowledge. • Observer data – Begin set – End haul – bottom temp observations are rare. • Study Fleet data – GPS polling and TD probes joined at 90 second intervals. • Data acquisition and QA/QC delays can be very significant. • Electronic logbooks can capture large volumes of haul specific data rapidly. • Turn-around time and map detail are critical system design issues. • More detailed information will support more detailed maps and other uses (e.g. discard estimation, Fishery dependent CPUE, sub-stock structure). Self-reported data quality must be verified. • A critical limitation or challenge for existing systems includes greater gear detail – relative to discard rates for new nets (accountability). • Industry likely interested in bottom temp forecasts at nautical sq mile spatial scales so that decisions on locations can avoid predicted hot spots for quota limited stocks.
Pelagic Longline – observer & surveys SEFSC Observer data 1992 – Present Generally 4 locations with dates and SST Historical records – 1957 – mid 1990s Earliest records single or two locations, majority with 4 locations, dates and SST