1 / 5

Supplementary Figure 1

Supplementary Figure 1. Fraction of breakpoints assembled. 0 20 100 200 400 1000. Breakpoint homology ( bp ). Homology measured by Fosmid ESP in Kidd et al. Cell (2010),

Download Presentation

Supplementary Figure 1

An Image/Link below is provided (as is) to download presentation Download Policy: Content on the Website is provided to you AS IS for your information and personal use and may not be sold / licensed / shared on other websites without getting consent from its author. Content is provided to you AS IS for your information and personal use only. Download presentation by click this link. While downloading, if for some reason you are not able to download a presentation, the publisher may have deleted the file from their server. During download, if you can't get a presentation, the file might be deleted by the publisher.

E N D

Presentation Transcript


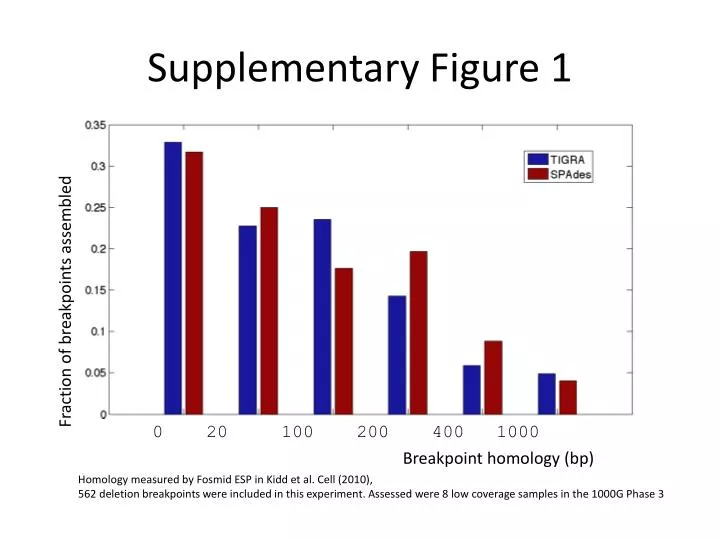
  1. Supplementary Figure 1 Fraction of breakpoints assembled 0 20 100 200 400 1000 Breakpoint homology (bp) Homology measured by Fosmid ESP in Kidd et al. Cell (2010), 562 deletion breakpoints were included in this experiment. Assessed were 8 low coverage samples in the 1000G Phase 3

  2. Supplementary Figure 2

  3. Supplementary Figure 3

  4. Unique1 Unique3 Repeat Unique2 Unique4 Supplementary Figure 4

  5. Supplementary Figure 5 homology Reference Contigs Reference Contigs

More Related