Download
1 / 12

E N D
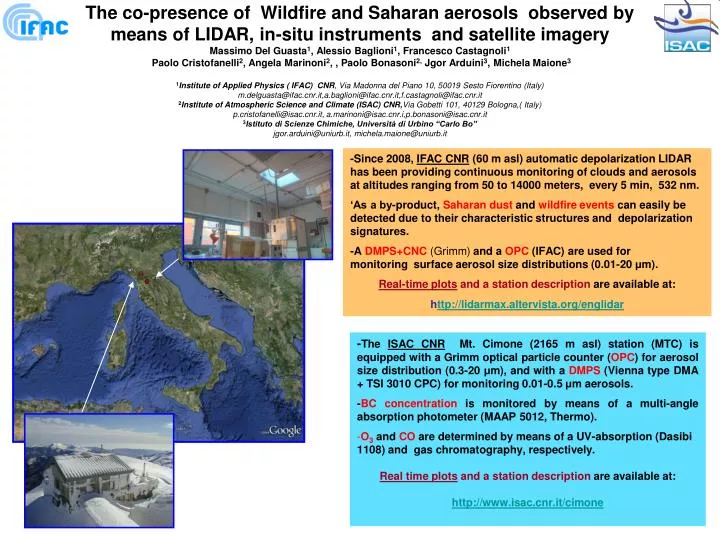
The co-presence of Wildfire and Saharan aerosols observed by means of LIDAR, in-situ instruments and satellite imageryMassimo Del Guasta1, Alessio Baglioni1, Francesco Castagnoli1 Paolo Cristofanelli2, Angela Marinoni2, , Paolo Bonasoni2, Jgor Arduini3, Michela Maione31Institute of Applied Physics ( IFAC) CNR, Via Madonna del Piano 10, 50019 Sesto Fiorentino (Italy) m.delguasta@ifac.cnr.it,a.baglioni@ifac.cnr.it,f.castagnoli@ifac.cnr.it2Institute of Atmospheric Science and Climate (ISAC) CNR,Via Gobetti 101, 40129 Bologna,( Italy)p.cristofanelli@isac.cnr.it, a.marinoni@isac.cnr.i,p.bonasoni@isac.cnr.it3Istituto di Scienze Chimiche, Università di Urbino “Carlo Bo”jgor.arduini@uniurb.it, michela.maione@uniurb.it -Since 2008, IFAC CNR (60 m asl) automatic depolarization LIDAR has been providing continuous monitoring of clouds and aerosols at altitudes ranging from 50 to 14000 meters, every 5 min, 532 nm. ‘As a by-product, Saharan dust and wildfire events can easily be detected due to their characteristic structures and depolarization signatures. -A DMPS+CNC(Grimm) and a OPC (IFAC) are used for monitoring surface aerosol size distributions (0.01-20 μm). Real-time plots and a station description are available at: http://lidarmax.altervista.org/englidar • -The ISAC CNR Mt. Cimone (2165 m asl) station (MTC) is equipped with a Grimm optical particle counter (OPC) for aerosol size distribution (0.3-20 μm), and with a DMPS (Vienna type DMA + TSI 3010 CPC) for monitoring 0.01-0.5 μm aerosols. • -BC concentration is monitored by means of a multi-angle absorption photometer (MAAP 5012, Thermo). • O3and CO are determined by means of a UV-absorption (Dasibi 1108) and gas chromatography, respectively. • Real time plots and a station descriptionare available at: • http://www.isac.cnr.it/cimone
Saharan dust events… Saharan dust advection is frequently observed in the Italy. Dust advection from Africa typically occurs by means of southern winds, which anticipate the passage of low pressure eddies and fronts. Statistics on the optical and altitude characteristics of Saharan dust clouds over the Mediterranean have mainly been obtained by means of LIDARs
Wildfires in Southern Europe: • Unfortunately, wildfires are also common events in the Mediterranean environment [2] • Supported by exceptionally high temperatures, violent wildfires occurred on 22-23 July 2009 in Spain, France and Algeria, and on 23-24 July 2009 in the islands of Corsica (F) and Sardinia (I) MODIS July 23, 2009 Spain 23 July 2009 MODIS July 24, 2009
Focusing on the wildfire days 23-24 July 2009 -The ash plumes from Corsica and Sardinia wildfires were visible to the naked eye on 24 July even at IFAC, at distances of 250 km and 450 km, respectively, from the two islands. -The plume was also observed by means of the IFAC LIDAR and MTC instruments that same day. -The ash plumes combined with a pre-existing Saharan dust layer, thus providing an experiment in aerosol science Sardinia, 23 July 2009
LIDAR, Aerosol and Chemical Measurements LIDAR processing was limited to retrieving the raw volume backscatter p and total depol. =s/p The event agrees with HYSPLIT trajectories (06-18UTC) (which showed the African origin of airmasses) and with the MTC enhancement of the 1-2 um coarse aerosols (desert dust [4]) from 07:00 to 24:00 The layers originated from the wildfires of Sardinia and Corsica. The EUMETSAT visible image (6 UTC) showed the spreading of the Sardinia and Corsica plumes over Italy at that time. Later on 24 July, Oceanic winds replaced southerlies and “cleaned up” the troposphere. The convective BL also scavenged the rest of smoke plume up to ~2000 m. Moreover, the high concentrations of fine aerosols, BC and CO confirm the influence of biomass burning emissions [5] also influencing the high values of O3 The diurnal development of the summertime PBL above IFAC is evident up to 2000 m after 10 UTC in the dep. plot. The advection of PBL polluted aerosols at MTC is suggested by the enhancement of 20-50 nm aerosols on the afternoon of 23 July. MTC data showed the enhanced presence of coarse particles,coupled with high CO and BC revealing the presence of biomass burning a cloud composed of a mixture of Saharan dust and wildfire smoke proceeding from N-Africa and Sardinia/Corsica was later detected. The dep. was 15% The presence of Saharan dust at an altitude above 1500 m is pointed out by the relatively high depolarization, which reaches 12-15% After midnight, the LIDAR showed the presence of aerosols between 2000 and 3000 meters: particles with sizes 50nm<D<200nm, with only a few coarse particles These layers showed a low depolarization (<7%) in agreement with other forest fire measurements [6]
SCATTERING SIMULATIONS We simulated the scattering properties of Saharan dust by using T-matrix (NFM-DS method) for axisymmetric spheroids of variable aspect ratio (0.8<AR<2), size parameter up to k=30, dk=0.04, and with a refractive index of n=1.55+i0.005 , =532 nm. Incident light was assumed to be linearly polarized. Once calculated the backscatter efficencies Qbp,Qbs, LIDAR volume backscatter (p,s) for a distribution of particle sizes are easily calculated
IN-SITU AEROSOL SIZE DISTRIBUTIONS • The aerosol data from MTC (DMA ,OPS) were automatically joined in order to obtain a size distribution every 30 minutes. • An automatic procedure was developed for fitting the SD by means of a sum of three lognormal distributions. The non-linear fit was performed by varying the median diameter (Doi) and geometric width (si) of each mode within a predefined range and by obtaining the lognormal peak values (foi) of the three modes by using the least squares method. The combination of the three distributions that provided the best fit of the measured size distribution was finally obtained by minimizing the distance between the simulated distributions and the measured one. • The ranges chosen for the lognormal parameters, on the basis of a previous local statistics were the following: Mode 1: 0.01 < Do1 <0.07 μm, 1.2<s1<2 Mode 2: 0.075 < Do2 <0.4 μm, 1.2<s2<2 Mode 3: 1< Do3 < 3 μm, 1.2<s3<2 . The two finer modes were simulated by using the Mie theory, by assuming an ammonium sulfatecomposition, in equilibrium with the MTC humidity. Sample of Size Distribution fit , 23 July 2009
MTC-IFAC depolarization closure experiment LIDAR quantities have been calculated from MTC distributions and compared with the same quantities observed by LIDAR at MTC altitude within a window of ±100 m (white lines) In other “pure” Saharan events, acceptable correlations were observed between measured and simulated depolarization values. In our case, the correlation was absent: measured total depolarization was much higher than the simulated one, also during the main dust event. This could be caused by an incorrect assumption as to the particle shape and refractive index. It is also probable that the fine modes strongly contributed to the measured depolarization.
CONCLUSIONS • This study confirmed the usefulness of the synergic use of an ordinary, automatic depolarizationLIDAR, satellite imagery and in-situ measurementsfrom a close mountain station for the interpretation of otherwiseconfused tropospheric aerosol events • The interpretation of this complex event would have been much trickier if we had relied on LIDAR data or in-situ markers alone • As confirmed by this case study, theMediterraneantroposphere can be simultaneously impacted byanthropogenic emissions, mineral dustfrom Sahara as well asbiomass burning. This makes simple scattering simulations unreliable • Since the two IFAC and MTC stations arepermanent monitoringstations, they provide the possibility of running this method at low costand for anunlimited period of time
REFERENCES Thank You! • [2] Grove, A.T., O. Rackham. 2001. The nature of Mediterranean Europe: An ecological history. New Haven, CT: Yale University Press. • [3]Freudenthaler V., M. Esselborn, M. Wiegner, B. Heese, M. Tesche, A. Ansmann, D. Muller, D. Althausen, M.Wirth, A. Fix, G. Ehret, P. Knippertz, C. Toledano, J. Gasteiger,M.Garhammer, M. Seefeldner, 2009, Depolarization ratio profiling at several wavelengths in pure Saharan dust during SAMUM 2006, Tellus, 61B, 165–179. • [4] Van Dingenen R., J.P. Putaud, S. Martin Dos Santos, F.Raes, 2005: Physical aerosol properties and their relation to air mass origin at Monte Cimone (Italy) during the first MINATROC campaign, Atmos. Chem. And Phys. 5, pp. 2203-2226. • [5] Cristofanelli P., A.Marinoni, J.Arduini, U.Bonafe, F. Calzolari, T. Colombo, S. Decesari, R. Duchi, M. C. Facchini, F. Fierli, E. Finessi, M. Maione, M. Chiari, G. Calzolai, P. Messina, E. Orlandi,F. Roccato, P. Bonasoni, 2009. Significant variations of trace gas composition and aerosol properties at Mt. Cimone during air mass transport from North Africa – contributions from wildfire emissions and mineral dust. Atmos. Chem. Phys., 9, 4603–4619. • [6] Lee C.H., Kim J.H., Park C.B., Shimuzu A., Matsui I., Sugimoto N.,2004, Continuous measurements of smoke of Russian forest fire by 532/1064 nm Mie scattering LIDAR at Suwon, Korea. 22nd Internation Laser Radar Conference (ILRC 2004), 2004 Matera, Italy. Ed. G.Pappalardo and A.Amodeo. ESA SP-561, 535-538