Download
1 / 32
320 likes | 506 Views
Gaseous and Particulate Emissions from Diesel Generators. Dongzi Zhu Desert Research Institute. Dirty Diesel engine. Non-road Diesel engine (contrary to Onroad) DPM higher than onroad diesel engines (HDDTs) contributes 44% DPM, 12% of NOx from all mobile sources nationwide (EPA)

E N D
Gaseous and Particulate Emissions from Diesel Generators Dongzi Zhu Desert Research Institute
Dirty Diesel engine • Non-road Diesel engine (contrary to Onroad) • DPM higher than onroad diesel engines (HDDTs) • contributes 44% DPM, 12% of NOx from all mobile sources nationwide (EPA) • exempt from fuel formulation (e.g. sulfur content) requirement, exhaust gas aftertreatment • Non-road Diesel Mobile/stationary sources: • construction, agriculture, locomotives, and marine vessels • back-up generators, pumps, etc. • NAAQS Criteria pollutants: PM(2.5,10), NOx, SO2, CO, O3,Pb • Diesel generators large emitter of PM most < 1mm, toxic air pollutants NOx, precursor of O3 Hydrocarbon(HC), PAH carcinogens, precursor of SOA, O3 CO, SO2
Nationwide, 626,000 installed units of diesel BUGs in 1996, estimated 1.7% annual increase rate (740,941 units 2006) • 11,000 diesel BUGs in California in 2000 • Evidence indicates human health hazards with exposure of diesel exhaust. • BUGs are close to school, hospitals, municipal buildings, where human exposure is high. • EPA regulated emission factors: NOx, PM, CO, NMHC (and fuel sulfur content) Tier 1 (1996-2000) (EPA,1994) Tier 2 (2001-2006) Tire 3 (2006-2008) (EPA,1998) Tire 4 (2008-2015): PM, NOx reduced by 90% (EPA, 2004) • EPA AP 42 diesel generator (<440KW) Emission Factors: NOx, PM,CO,CO2 THC, (1996) Population density and diesel BUGs location in L.A. region Population/mile2 0–2000 2000–6000 6000–10000 > 10000
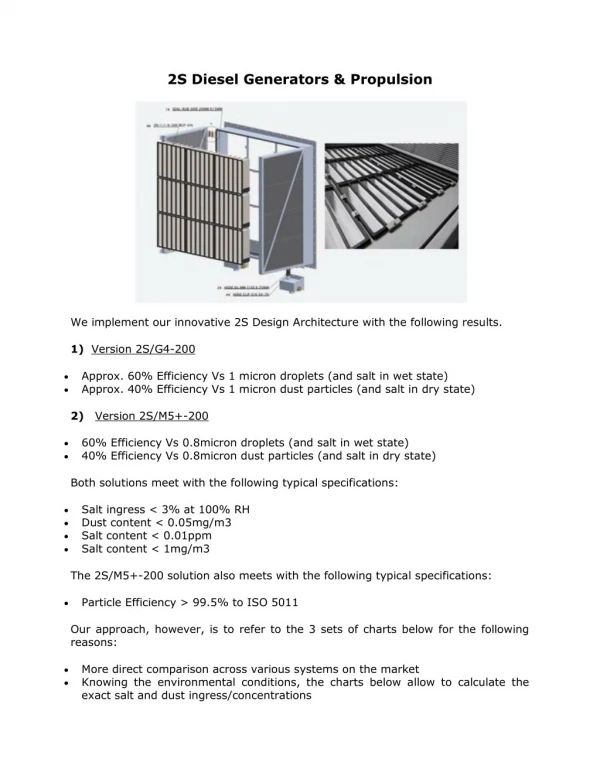
Tested 13 diesel generators (10KW-100KW) at Camp Pendleton, CA, using DRI’s In-Plume Emissions Testing System • Fuel analysis showed the jerrycan fuel had different properties than the fuels in the generator tanks. 60KW and 100KW tanks has JP-8 fuel. • Communications indicated that the base was temporarily unable to obtain JP-8 fuel for the generators and that were using California #2 Diesel to refuel the generators when needed.
Fourier Transform Infra-Red spectrometer • Beer-Lambert law: exponential attenuation • I1/I0 transmission spectrum T, fraction of radiation reaching detector on y-axis with wavenumbers (equivalent to freq.) (1/cm) on the x-axis • log10(1/T) = A absorbance • a is absorption coefficient • C is concentration • L is the distance that the radiation travel through the sample i • I1=I0 exp(-al) Detector Source radiation
Transmission spectrum and absorbance spectrum Sample % radiation reaching detector Absorbance Reference Wavenumber (1/cm) Wavenumber (1/cm) An example of a transmission spectrumCO22500 ppm The (sample) region to represent a NO2 concentration of 39 ppm. This is consistent with the reference spectrum concentration of 30 ppm.
H2O and CO2 FTIR Spectra Li-Cor LI-840 CO2/H2O Gas Analyzer
Particle measurement Photoacoustic Instrument measures the magnitude of the shock wave when a laser beam heats up a light absorbing particle, correlated with aerosol black carbon mass Dustrak: optical measurement intensity of light scattered from aerosols, aerosol concentration < 2.5 mm, or 10 mm ELPI Electrical Low Pressure Impactor measure of the number concentration of the particles and their aerodynamic size between 7 nm and 10 mm. GRIMM aerosol spectrometer measures light intensity scattered from the aerosol, the size of the particles, number concentration of the aerosol. Filter: Gravimetric & Chemical analysis
Table 1. In-Plume Sampling Test Matrix in Camp Pendleton, CA from Nov 14 to 16, 2005. a. Unit tested five distinct loads only b. Unit tested cold start only.
Time series of background corrected CO2, CO, Ethylene, and NO from Camp Pendleton 2005/11/15.
Results 1): Gaseous Emission Factors CO • EFs of CO, Ethylene, and NO2 all decrease with increasing engine load • cold start emissions are higher than the hot stabilized, except NO Ethylene NO
Continued: Gaseous Emission factors NO2 Propane +Hexane • HC EFs generally small (< 20 g/kg fuel) and increase moderately with engine load, NH3 below detection limits. NH3
Particle measurement Instrument Intercomparison: DustTrak PM2.5 and PM10 • the engine exhaust is composed of small particles less than 2.5 mm and well-mixed
DustTrak vs GRIMM Mass of particles measured by GRIMM less sensitive to changes in the size distribution, the Grimm calculates PM2.5 mass based on an integrated measure of the particle size distribution.
DustTrak vs Photoacoustic . The relative fraction of black carbon to total aerosol mass can change as a function of engine, operating load, and air fuel mixture, weak correlation is expected.
ELPI0.263 (5 stages) vs DustTrak PM2.5 DustTrak laser light wavelength of 780 nm, less sensitive to particles < 300 nm. These two measuring independent portions of particle size distribution Moderate correlation indicates larger particles (300 nm to 1000 nm) measured by the DustTrak are generally coincident with the smaller nano particles measured by the ELPI.
. Composite size distribution of engine exhaust PM measured by ELPI and GRIMM size distributions overlap indicating that both measurements are physically consistent ELPI is known to have a large bias for particles greater than 500 nm when sampling high concentration (>1 mg/m3).For PM EF calculation, ELPI PM less than 0.263 is added to DustTrak PM2.5 mass
Time series of real time PM instrument measurements from Camp Pendleton Generator Match test: concentration peaks shows well synchronized, No need to subtract background since source is 2 orders higher.
PM fuel based emission factors for 10 kW, 30 kW generators EFs for the 10 kW generators were highest at the 100% load.
PM fuel based emission factors for 60 kW, 100 kW generators All but the 100 kW generator showed an increase in PM EF as load increased to 75% 100 kW unit had the highest emissions and showed a steady decrease in EF as increased load
Average PM EFs based on generator rated load. No substantial increases in emissions were seen for the cold start tests.
Average black carbon EFs based on generator rated load BC EF Patterns are consistent with the total PM EFs. BC emissions were highest for the 10 kW generators operating at 100% load. The 100 kW generator had constant BC emissions for 10%-75% loads, but increased by a factor of 3 at the 100% load.
Conclusions • Gaseous EFs show a strong consistency across engine types. • EFs of CO, Ethylene, and NO2 all decrease with increasing engine load, cold start emissions of these species higher than the hot stabilized. • Emissions of NO increase only slightly (<50%) over the operating modes from 10% to 100%. The cold start NO EFs are lower than hot stabilized EFs. • HC EFs generally small and increase moderately with engine load. Ammonia emissions are low detection limits • Fleet average of CO EF is 5% lower than AP 42, NOx EF is 74% lower than AP 42 estimates.
Conclusions (2) • Fleet average PM EF was 4.498 g/kg fuel, 25% less than the AP 42 estimates • With exception of the 100 kW generator, all engines showed an increase in PM EF as load increased to 75%. The 100 kW unit had the highest PM emissions and showed a steady decrease in EF as load increased. No substantial increases in PM emissions for the cold start tests. • compared with MEL of CE-CERT for similar engine sizes, while gaseous EF is comparable, the PM EF has a 3 times difference might due to different measurement methodologies.
Acknowledgement • Hampden Kuhns, Nicholas Nussbaum, Oliver Chang, David Sodeman, Sebastian Uppupalli, Hans Mussmuller, John Watson • Strategic Environmental Research and Development Program project funding