Download
1 / 27
270 likes | 367 Views
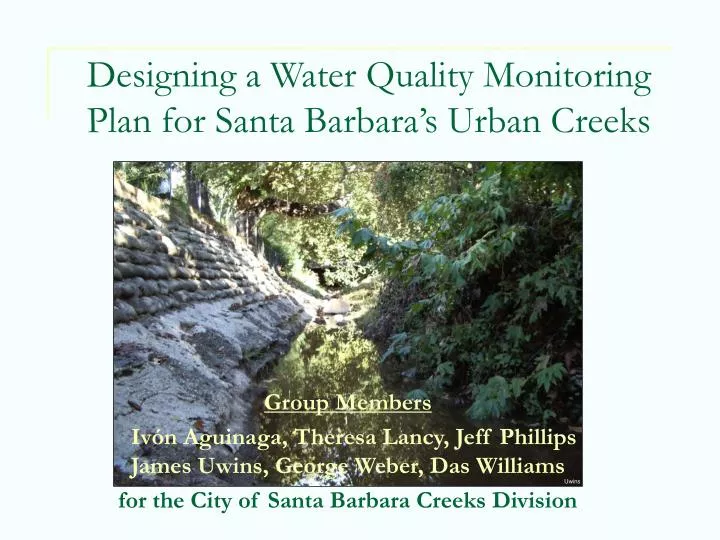
Designing a Water Quality Monitoring Plan for Santa Barbara’s Urban Creeks. Group Members Iv ó n Aguinaga, Theresa Lancy, Jeff Phillips James Uwins, George Weber, Das Williams for the City of Santa Barbara Creeks Division. Uwins. Background.

E N D
Designing a Water Quality Monitoring Plan for Santa Barbara’s Urban Creeks Group Members Ivón Aguinaga, Theresa Lancy, Jeff Phillips James Uwins, George Weber, Das Williams for the City of Santa Barbara Creeks Division Uwins
Background • Nonpoint source pollution has received increasing attention in coastal waters • “Creeks Fund” ballot initiative passed in 2000 in City of Santa Barbara • Created a 2% increase in bed tax • Established the Santa Barbara Creeks Committee and Creeks Division • Funds restoration, treatment systems and water quality initiatives
Watersheds Arroyo Burro Creek Mission Creek Sycamore Creek Laguna Channel
Client Needs The City of Santa Barbara desires a land use based monitoring program to assess water quality in the city creeks. MONITORING PLAN OBJECTIVES
Monitoring Plan • Monitoring plan objectives were developed using guidance from Water Quality Control Plan, Basin Plan for the Coastal Watersheds (RWQCB) – June 1994 • Six primary objectives:
Monitoring Plan Objective 1 Measure current water quality and long-term trends.
Monitoring Plan Objective 2 Identify impaired water quality that may adversely affect human or ecological health in the creek corridors.
Monitoring Plan Objective 3 Provide information needed to relate creek water quality to inputs of pollutants by different land uses.
Monitoring Plan Objective 4 Provide data in a format compatible with 'clearinghouses' for water quality data maintained by the state or federal government (e.g. EPA STORET database).
Monitoring Plan Objective 5 Report on water quality conditions as required by federal and state regulations or requested by others.
Monitoring Plan Objective 6 Provide data needed to assist in framing the planning process for Watershed Action Plans and design of appropriate Best Management Practices.
Project Design Land Use Analysis Watershed Delineation Existing Data Review / Case Studies Predictive Modeling Selection of Constituents of Concern Select Sample Sites Formulate Monitoring Plan
Land Use Analysis • SB County Long Term Ecological Research (Anderson Level III Land Uses) • City of SB Spatial Database • 1-meter color orthophotos (2000) Watershed Delineation • Digital Elevation Maps (DEMs) • Storm drain, street, and sewer Computer Assisted Drafting (CAD) files • Manually defined watersheds
Existing Data Review / Case Studies • Los Angeles County • Orange County • CCAMP • Santa Barbara City and County
Selection of Constituents of Concern • Constituents of concern identified via case studies and literature review • Literature review began with EPA and USGS analyte lists • List cross-referenced with research that examined the relation of specific analytes to land uses
Automatic Delineation vs. Manual/Predefined Delineation Predictive Modeling – SWAT Model Final Model
Monitoring Protocol • NAWQA- National Water-Quality Assessment Program • USGS program that outlines a nationally consistent design structure • Fixed-interval Sampling versus Extreme-flow Sampling • FINAL PRODUCT = PRACTICAL SAMPLING PLAN • Location feasibility • Representation of land uses • Quality Assurance / Quality Control
Selection of Sample Sites INTEGRATOR SITES INDICATOR SITES
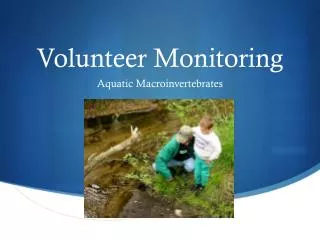
Field Test • October 16, 2004 - first rain event in Santa Barbara since February • Sampled from three sites based to capture specific land uses • Residential • Commercial • Industrial
Field Test • Analytes • Herbicides – Glyphosate • Pesticides – Diazinon • Oil & Grease • Total Recoverable Petroleum Hydrocarbons • Nutrients – Nitrate and Total Phosphorous • MBAS (surfactants) • Bacteria – TotalColiforms, E. Coli, and Enterococcus • Metals • Parameters • pH • Temperature • Dissolved Oxygen • Turbidity • Biological Oxygen Demand • Chemical Oxygen Demand
Field Test – Sample Site 1 • Upper Arroyo Burro Creek (San Roque tributary) • Low to Medium Density Residential
Field Test – Sample Site 2 • Arroyo Burro Creek (La Cumbre Mall stormdrains) • Commercial
Field Test – Sample Site 3 • Laguna Channel • Industrial and Mixed Use
Field Test • Results • Chemical concentrations below detection limits for all analytes • Significant bacteria levels • A subsequent storm will be sampled at the same locations for same parameters and analytes
Future Directions • Protocol Recommendations • Site Selection • Sampling Frequency • Data Management System • Sampling Costs • Policy Options
Acknowledgements • City of Santa Barbara: Creeks Division, Public Works, and Waterfront Staff • Bren School: Tom Dunne, Arturo Keller, Patricia Holden, and Peng Wang • LTER: John Melack, and Timothy Robinson • URS: John Gray • County Project Clean Water: Rob Almy, Tommy Lidell