Download
1 / 148
1.48k likes | 1.6k Views
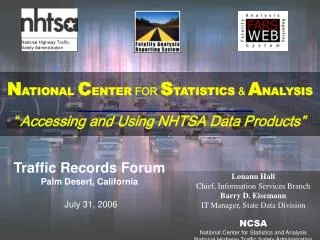
National Highway Traffic Safety Administration. N ATIONAL C ENTER FOR S TATISTICS & A NALYSIS “ Accessing and Using NHTSA Data Products”. Florida A&M Workshop Washington, DC. Louann Hall Chief, Information Services Branch Barry D. Eisemann IT Manager, State Data Division NCSA

E N D
National Highway Traffic Safety Administration NATIONAL CENTER FOR STATISTICS & ANALYSIS“Accessing and Using NHTSA Data Products” Florida A&M Workshop Washington, DC Louann Hall Chief, Information Services Branch Barry D. Eisemann IT Manager, State Data Division NCSA National Center for Statistics and Analysis National Highway Traffic Safety Administration April 26, 2006
National Center for Statistics & Analysis Agenda: NCSA Overview NCSA Products Contacting & Obtaining Traffic Safety Information Hands-On Training – FARS Web Reports
Disseminate Collect Analyze National Center for Statistics & Analysis WHAT WE DO:
National Center for Statistics & Analysis Data Systems Fatality Analysis Reporting System • ALL Fatal Crashes • 1975 to Present • Data Sources • Police Crash Reports • State Vehicle Registration Files • State Driver Licensing Files • State Highway Department Data • Vital Statistics • Death Certificates • Coroner/Medical Examiner Reports • Hospital Medical Records • Emergency Medical Services Reports 4
National Center for Statistics & Analysis Data Systems General Estimates System • SAMPLE of ALL Crash Severities • Since 1988 • PAR Data Crashworthiness Data System • SAMPLE of ALL Crash Severities • In-depth Investigations 4
Special Crash Investigations (SCI) National Center for Statistics & Analysis • In-depth investigations on a limited number of crashes • Operations • Three (3) elite rapid response teams • Located in the East, Midwest and West
National Center for Statistics & Analysis National Driver Register • Problem Driver Pointer System (PDPS) • National database of identification data for problem drivers • Purpose – To improve traffic and transportation safety
National Center for Statistics & Analysis National Occupant Protection Use Survey (NOPUS) • Tracks Occupant Restraint Use • Moving Traffic • Controlled Intersection
National Center for Statistics & Analysis Examples of Uses of NOPUS Data • State safety belt and child restraint laws • DOT cell phone policy • Calculate number of lives saved due to safety belt usage
14 Annual Fact Sheets • OVERVIEW FACT SHEET • 10 years of trend data • Data on high interest program areas • ALCOHOL STATE ESTIMATES • STATE TRAFFIC DATA • ALCOHOL • OCCUPANT PROTECTION • SPEEDING • MOTORCYCLES • LARGE TRUCKS • SCHOOL BUS • PEDESTRIANS • PEDALCYCLISTS • OLDER POPULATION • YOUNG DRIVER • CHILDREN 5
NEED DATA? NCSA Web Sitewww.nhtsa.dot.gov/people/ncsa Call: 800-934-8517 Data/Info Requests Fax-On-Demand
CHAPTERS - Trends - Crashes - Vehicles - People - States
“Did You Know?” Archive States 3
Acronyms 4
Terms 5
Terms 5
Terms 5
Trends 1994-2004 Fatal Crashes Fatalities & Fatality Rates 7
Vehicles Involved in Fatal Crashes, 1994-2004 Passenger Cars Light Trucks Large Trucks Motorcycles 9
Persons Killed by Person Type & Vehicle Type, 1994-2004 Occupants by Vehicle Type Nonmotorists 9
Passenger Car Occupants Killed …, 1994-2004 1994 - 21,997 2004 - 19,091 Light Truck Occupants Killed …, 1994-2004 Registrations 59,485,995 85,657,140 1994 - 8,904 2004 - 12,602 11
Persons Killed by Highest BAC…, 1994-2004 Alcohol Related Fatalities 2004 - 39% 13
Drivers … by Restraints Used…, 1994-2004 Restraints Used 1994 - 49.1% 2004 - 60.6% 15
Fatal Crashes by Time of Day & Day of Week Sat, midnite-3AM – 1,174 Fri, 6-9PM – 1,013 Fri, 9-midnite – 1,070 Sat, 6-9PM – 997 Sat, 9-midnite – 1,108 18