Download

1 / 25
250 likes | 378 Views
GETTING STARTED Workshop Track A Wednesday , June 5, 9am-10am. Gretchen Donehower University of California at Berkeley, Demography United States. Workshop objectives Understand how to begin constructing NTA Get started on macro controls, lifecycle accounts

E N D
GETTING STARTEDWorkshopTrack AWednesday, June 5, 9am-10am Gretchen Donehower University of California at Berkeley, Demography UnitedStates
Workshop objectives • Understand how to begin constructing NTA • Get started on macro controls, lifecycle accounts • Create country-team poster for Friday’s poster session • Welcome and greetings! • Who are you? • What are your NTA objectives? • Tell us about your data, what you have, what you need to find • Population counts • National accounts • Household surveys and administrative records • Does everyone have access to the NTA wiki? (www.ntaccounts.org) Preliminaries
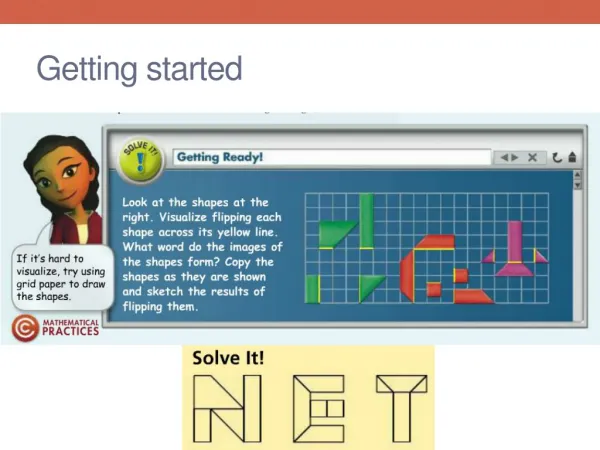
What is an age profile? • A schedule of age-specific average flow amounts • Based on flow measure or proxy indicator from • a household survey • a government report • other NTA age profiles • NTA assumptions • Smoothed • Adjusted up or down so that aggregate flow matches an aggregate estimate from national accounts Preliminaries
Organization of Accounts Transfers have inflows and outflows. Also collect a full set of tax profiles.
3.1 Materials • Necessary human and computer resources • Helps to have a team • Knowledge of institutional features of the country • Computing skills (spreadsheets, survey data analysis and programming in Stata, R) • Use saved programs, not point-and-click • Makes revision easier • Makes sharing with others easier, across the NTA network and over time within your country
3.1 Materials • Data requirements • General: same time period, nationally representative, sufficient age detail • Also want detail on any sub-groups you are interested in studying (e.g. sex, region, urban/rural, SES indicators like educational attainment) • Population estimates • Single year of age to 90+ • Evaluate quality of estimates (see Appendix) • Can use UN World Population Prospects if problems with national estimates • Significant non-household population?
3.1 Materials • Data requirements (cont.) • National accounts data • Get as much of it as you can find • List of main SNA tables given in the manual • Need tables by SNA sector • Which government agencies produce your accounts? How do they publish the results? What is available in international databases? • Beware revision schedules! • Will probably also need • government budget documents • entries for your country in the International Monetary Fund’s Government Finance Statistics (GFS) publications
3.1 Materials • Data requirements (cont.) • Household surveys and administrative records • Income and expenditure surveys • Direct measures or indicators of relative age pattern • Specialized surveys on sub-groups • Older people • Persons not in households (e.g. nursing home population) • Administrative data • Government reports on public program participation by age • May give monetary flows • May only have participation indicators
3.1 Materials • Data requirements (cont.) • Household surveys and administrative records • Features: • Nationally representative • Designated household head • Sufficient sample size • Household roster by age, sex, work/school status • Detailed income by source data • Detailed expenditure by type data
3.2 Building a micro-level database • What goes in it? • Age profiles in the database • Start with your income and expenditure survey, create NTA variables from survey items • Merge on any external NTA variables to each person • Example: merge records on publicly provided health care by age of individual • Can use as many additional characteristics in the merge as data allows • Other information in the database • Population counts • Macro controls • What can you do with it? • Calculate NTA age profiles • For intra-household transfers, especially (must have a micro-level database with macro-adjusted individual-level age profiles for a set of variables to computer intra-household transfers) • Other interesting studies: • Sub-groups (regions, sex, urban/rural, socio-economic status) • Explore variability (medians instead of means, percentiles)
3.3 Basic methods • Aspects of an NTA age profile • Per capita measure by age • Can be direct measure or proxy • Smoothed • Reduces noise from sampling • Smooth lowest-level components • Beware of eliminating “real” features of the age pattern • Peaks/valleys, elbows, zeros • False negative values should be replaced with zeros • Details and examples in Appendix
3.3 Basic methods • Aspects of an NTA age profile • Macro-adjusted Scale Factor Calculation: Apply Scale Factor:
3.3 Basic methods • Steps to follow in calculating an lowest-level age profile • Calculate the macro control • Identify measure or proxy indicator and make it a part of the micro-level database • 1. From household survey (with survey weights if applicable) • Use individual-level data if available • Otherwise allocate household amount to individuals in the household • 2. From administrative records (merge onto micro-level database) • 3. On a priori grounds (i.e. assumed or calculated from other age profiles) • Calculate the single year age group averages • Adjust age shape for any missing populations (i.e. persons not represented in survey or administrative records) • Smooth • Evaluate to ensure that no real variation has been eliminated • Adjust smoothed and non-smoothed profiles to controls • Evaluate adjustment factor to test the validity of the age shape
3.3 Basic methods • How many low-level age profiles to calculate? • Must have lowest-level of NTA reportable profiles, but below that, making sub-profiles can improve estimates • Just need identifiable macro controls and different age pattern indicators (example of different levels of education) • Build higher-level age profiles by adding up lower-level age profiles • Don’t re-smooth higher-level profiles • Don’t combine profiles with different final age categories
3.3 Basic methods • How to evaluate resulting age profiles • Internal NTA validity checks • Verify aggregate amount matches macro control • Evaluate smoother (plot smooth and unsmoothed) • Sub-profile consistency with higher-level profiles? • Does age profile look reasonable compared to other countries in the NTA database? • Is age profiles >0, <0 or =0 in appropriate age ranges? • Role of children • Do balancing flows actually balance? • External validity checks • Are macro controls reasonable relative to SNA amounts from international databases? • Do your estimates agree with other researchers who have studied the topic? • Overall plausibility in the country context
3.3 Basic methods • Document and archive estimates • Write up methods for each age profile with references and data sources • In simple tables or a technical paper or country-specific NTA manual • Save all computer programs and add thorough comments • Upload finalized age profiles and documentation to on-line database at www.ntaccounts.org
Lab Exercise – Start Poster • Create “DATA” and “COUNTRY BACKGROUND” sections for poster • See list of example items • Plot age schedule of population for NTA year to create “POPULATION” section for poster; if possible add TFR and life expectancy