Download
1 / 50
500 likes | 686 Views
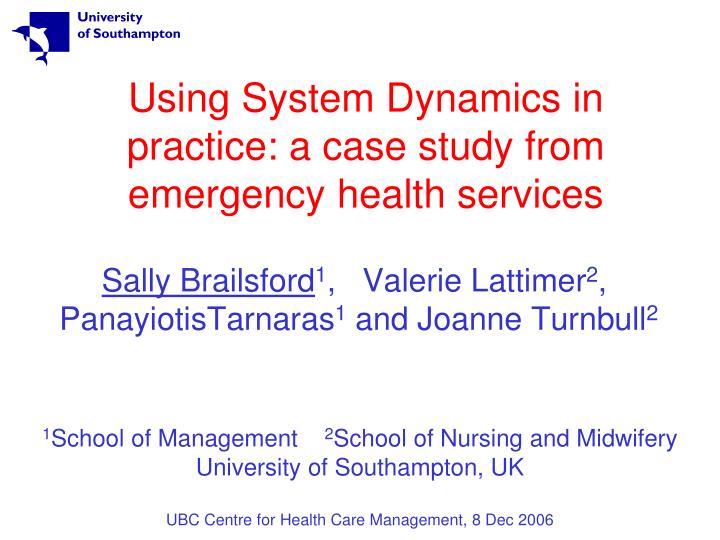
Using System Dynamics in practice: a case study from emergency health services. Sally Brailsford 1 , Valerie Lattimer 2 , PanayiotisTarnaras 1 and Joanne Turnbull 2. 1 School of Management 2 School of Nursing and Midwifery University of Southampton, UK

E N D
Using System Dynamics in practice: a case study from emergency health services Sally Brailsford1, Valerie Lattimer2, PanayiotisTarnaras1 and Joanne Turnbull2 1School of Management 2School of Nursing and Midwifery University of Southampton, UK UBC Centre for Health Care Management, 8 Dec 2006
Outline of talk • Brief background to the Nottingham Emergency Care / On Demand project • Using system dynamics – qualitative and quantitative approaches • Our practical experiences • Patient preference study • Key results, implementation of findings, and conclusions
The city of Nottingham • Robin Hood’s home town • City with population just under 650,000 in east Midlands of England • Mainly urban population with some areas of social deprivation
Health services in Nottingham • Two large NHS Trusts (i.e. hospitals) • Queens Medical Centre: University teaching hospital, 1100 beds • Nottingham City Hospital: 850 beds • One Accident & Emergency (A&E - the ER) department – at QMC • 5 Primary Care Trusts, 350 GP’s
Background to the project • Increasing emergency hospital admissions in Nottingham (>4% year on year increase since 1999) • Busiest (?) Accident & Emergency Department in the country; >122,000 patients in 2000/01 • Winter beds crises: “red alerts” and ward closures • Pressure on staff – stress, recruitment and retention problems • Steering Group set up in 2001 to develop Local Services Framework for unscheduled care • University of Southampton commissioned to provide research support to project
Membership of steering group • Clinicians and managers from hospitals (plus A&E) • In-hours and out-of-hours GP services • Ambulance Service • Social Services • Mental Health Services • NHS Direct (integrated with out-of-hours GP service) • NHS Walk-in Centre • Patient representative groups • Community Health Council representatives
The Southampton research team • Val Lattimer, MRC Research Fellow, School of Nursing and Midwifery • Helen Smith, Reader in Primary Medical Care, Health Care Research Unit • Karen Gerard, health economist, HCRU • Steve George, Reader in Public Health Medicine, HCRU • Mike Clancy, A&E Consultant, Southampton University Hospitals Trust • Me • Panayiotis Tarnaras and Jo Turnbull, RA’s
Strands of the research • Literature review and comparison with other Health Authorities • Stakeholder interviews • Activity data collection • System dynamics modelling • Descriptive study of patient pathways • Patient survey and preference study
System Dynamics • Based on Jay Forrester’s Industrial Dynamics (1969) • Aim: to analyse complex interacting systems • Principle: “structure determines behaviour” • Qualitative aspect: causal loop(influence)diagrams, to gain understanding of system behaviour • Quantitative aspect: stock - flow models
Qualitative models: influence diagrams + Student numbers Staff stress levels – Research papers published • Link system constructs (real or abstract) • Identify feedback loops • Balancing loopshave odd number of “–” signs • Reinforcing loops orvicious circleshave even number of “–” signs
Feedback loop + Student numbers Staff stress levels + – Research papers published Student recruitment + + Reputation of university
A balancing loop + Student numbers Staff stress levels + – Research papers published – Student recruitment + + Reputation of university
Number of students time Behaviour over time
– A balancing loop – Waiting lists Hospital beds available – – GP referral rate
– Waiting lists Hospital beds available + + – GP referral rate A vicious circle + Extra Govt money + – Patient demand +
Pros & cons of qualitative models • Can explore unanticipated side-effects, and identify performance indicators to flag up when these side-effects begin to be felt • Cannot tell which loops will dominate without quantifying effects – can be difficult and subjective
Quantitative models • Need to quantify model parameters to tell which loops dominate, and when • Can suggest useful performance indicators even if numerical data is not available (e.g. “staff stress levels”) • Software: Vensim, Stella (ithink)
Levels (stocks) Rates (valves): control flow Quantitative models: stocks and flows
The underlying maths • Stock-flow equations: ordinary differential equations, discretised as difference equations with finite timestep dt • Various solution methods used, in different software packages • Deterministic - “simulation” is not stochastic
Why System Dynamics? • Huge, diverse, complex system • Many stakeholders with opposing viewpoints • Long timescale (5 years) • Hundreds of thousands of “entities” • Waiting times less important than process flows • Lack of accurate data in sufficient detail from some providers • Gaining insights more important than numerical predictions
Modelling phases • Qualitative: stakeholder interviews and development of patient flow map; influence diagramming used to focus discussion about specific subsystems • Quantitative: Stella model, populated with 2000 – 01 data, used to investigate (24) different scenarios, some suggested by Steering Group and others by us
Stakeholder interviews • Outline draft of patient pathways map derived in orientation visit (August 2001) • 30 interviews during Sept - Oct 2001 • Respondents were asked … • About own work area and areas of influence • To identify where they thought bottlenecks arose • To discuss factors which had shaped the system, and barriers to future development (local politics!) • To scribble on and amend the map where they thought we had got it wrong
WIC NEMS Healthcall NHSD Patient pathways through the emergency care – on demand system Map version 2: for modelling Arnomedic GP OOH GP in-hours Social Services: EDT, SAO’s, Hospital SW’s Home care & ongoing casework EMAS A & E DPM Elective admissions D55: CCU Home D57 OP clinics: direct to wards (QMC and City) Specialty wards QMC Further care and intermediate care Paediatrics GP adm D56 Home Specialty wards City Assessment unit Patience wards CMHT Further care and intermediate care Coronary care, Burns & plastics, Stroke unit City Elective admissions Dialysis / oncology / COPD patients etc Patient flow map
Data for the Stella model • Many problems obtaining data (!!!) especially, but not exclusively, in primary care • Used 2000-01 activity data for “arrivals” • Length of stay, and patient pathways within the hospitals, obtained from Dept of Health Hospital Episode Statistics data, patient surveys and from interviews with hospital staff • Internal validation by checking flow balances
Using the Stella model • Regular trips to Nottingham to demonstrate the model as it evolved • Different people at each meeting! • No problems accepting “continuous” patient flows; happy with SD technicalities once explained • Panel found the computer model fascinating and were keen to suggest scenarios to test
Experimental scenarios • Reconfigurations of services, e.g. • Longer opening hours for Walk-in Centre • Minor cases sent to WiC instead of A&E • More “step-down” beds to reduce LoS • New services, e.g. • (Diagnostic and) Treatment Centre • Services targeted at specific patient groups
Trust me, I’m a computer • Wide spectrum of computer literacy and quantitative skills in the Steering Group panel • Stella model looked impressive because it was complicated • Clients warned not to over-interpret the numbers • Balance provided by couple of “computer sceptics” in the Steering Group
Main results from Stella model • Current rate of growth is not sustainable without extra resources: up to 400 cancelled elective admissions per month after 5 years • High impact of relatively small changes • Alternatives to admission more effective than discharge management in reducing occupancy • Some benefits of moving less severe patients away from A&E
Patient preference study • Discrete choice experiment (designed and led by health economist Karen Gerard) • Enable trade-offs between different aspects of service to be evaluated • Respondents - the users of emergency services (n = 378) • Patients also asked what factors influenced their choice of service on that particular day
Attribute Level Level description Contacting the service 1 By telephone, 2 or more calls 2 By telephone, 1 call 3 In person Where advice / treatment takes place 1 Travel 15 miles 2 Travel 5 miles 3 At home, no travel Time waiting for advice / treatment after initial contact 1 4 hrs 30 minutes 2 2 hrs 30 minutes 3 30 minutes Whether kept informed of expected waiting time 1 No information 2 Some information 3 Full information Who advices / treats 1 Paramedic 2 Specialist nurse 3 Doctor Quality of contact time 1 Not enough time to deal with problem, interruptions 2 Enough time to deal with problem, interruptions 3 Enough time to deal with problem, no interruptions Attributes to be compared
Imagine that you are at home. You decide you are in need of urgent medical advice or treatment. It is sometime after the GP surgery has closed. You decide to contact an out-of-hours service. Which service would you choose? Service A Service B Making contact Single telephone call In person Where advised At home, no travelling Nearest NHS facility 15 miles Waiting time between initial contact and advice 2½ hours 4½ hours Informed of expected wait No information No information Who advices Specialist nurse Doctor Quality of contact Enough time, no interruptions Not enough time, interruptions Tick one box only
Main findings • Keep people informed!! Patients prepared to wait extra 86 minutes for better information • Younger patients (<45) preferred doctor advice – would trade for services located nearer home; this was less important for older patients • Lack of interruptions important : location less so • Potential need to tailor services for older patients, who are happier to accept treatment by specialist nurses and paramedics
Influence diagrams • Mainly used to focus panel discussion on specific issues arising from interviews and patient preference study, e.g. • Increased re-admission rates due to premature discharge • Effect of GP’s sending patients to A&E to “queue-jump” waiting lists for investigations • Patient behaviour due to long expected waits • Other behavioural effects: stimulating demand by providing improved service?
Patients choosing to go to Walk-in Centre + Additional resources placed in A&E to provide better service + Long waiting times in A&E + + Self-referrals to A&E Creating demand? - a feedback loop
Patients choosing to go to Walk-in Centre + Additional resources placed in A&E to provide better service + Long waiting times in A&E + + + Self-referrals to A&E Creating demand? - a feedback loop
Implementation • Results presented to Steering Group in May 2002 • “Stakeholder day” at Nottingham Forest Football Club, June 2002 • Local Services Framework developed and implemented by August 2002!
Pros and cons of SD • Excellent for studying interconnections between individual departments/providers and the wider health system • Very powerful tool giving global view of whole system • Loss of individual patient information and variability between individuals • Cannot produce highly detailed numerical results • Difficult to use for operational decision-making: better for strategic policy-making
My personal view of using SD • Qualitative aspects were very useful (interviews, maps & influence diagrams) • Stella model was compelling focus for stimulating discussion and ideas • Suspect that some people still fixated on the numbers despite all the health warnings • Some places where software was inadequate for modelling: e.g. effects of variability, decision logic governing flows
S.C. Brailsford, V.A. Lattimer, P.Tarnaras and J.C. Turnbull, “Emergency and On-Demand Health Care: Modelling a Large Complex System”, Journal of the Operational Research Society, 2004, 55:34-42. V.A. Lattimer, S.C. Brailsford et al. Reviewing emergency care systems I: insights from system dynamics modelling. Emerg Med J, 2004, 21:685-691 K. Gerard, V.A. Lattimer, H. Smith, S.C. Brailsford et al. Reviewing emergency care systems II: measuring patient preferences using a discrete choice experiment. Emerg Med J, 2004, 21:692:697 References