Download
1 / 16
160 likes | 220 Views
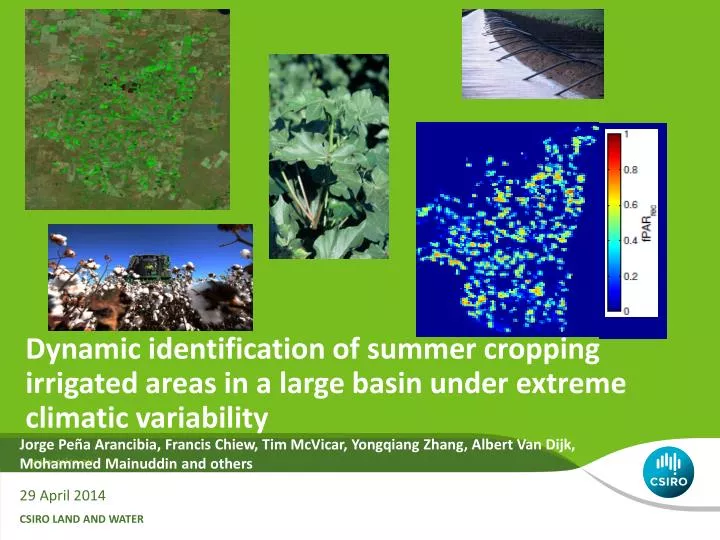
Dynamic identification of summer cropping irrigated areas in a large basin under extreme climatic variability. Jorge Peña Arancibia, Francis Chiew, Tim McVicar, Yongqiang Zhang, Albert Van Dijk, Mohammed Mainuddin and others. 29 April 2014. CSIRO Land and Water.

E N D
Dynamic identification of summer cropping irrigated areas in a large basin under extreme climatic variability Jorge Peña Arancibia, Francis Chiew, Tim McVicar, Yongqiang Zhang, Albert Van Dijk, Mohammed Mainuddin and others 29 April 2014 CSIRO Land and Water
Irrigation in the Murray-Darling Basin • The MDB (1,059,000 km2): 41% national agricultural production • Irrigation: Only 2% of the total agricultural land in the MDB • 66% of Australia's agricultural water consumption (7.7bn m3) • 31% of the basins’ gross value of agricultural production ($ 4bn). • Precipitation: High spatiotemporal variability • P=457 mm y-1 (ETa is 96%) • Periods of drought and flooding • Large regulation. Irrigation EGU 2014 | Jorge Pena| Page 2
Mapping of irrigation using remote sensing Recurrent NDVI at 250 m resolution: the 353th day of the year (white = summer crops): Dry period Wet period Irrigation EGU 2014 | Jorge Pena| Page 3
Objectives • Identify the location and extent of irrigated areas on a year by year basis from 2004/05 to 2010/11 • Use these outputs to constrain existing hydrological and river models • Identification of areas that require better monitoring • Supervised classification: Random Forest • ‘Bagging approach’ • Random perturbation to generate an ensemble of classification trees • Reduces the variance without overfitting Irrigation | Jorge Pena| Page 4
Training: phenology and water use • Phenology: TS remotely sensed inputs of vegetation greenness from MODIS • Water use: TS remotely sensed evapotranspiration estimates Two Random Forest Models Monthly values for each water year of: Total of 120 covariates fPARrec,i d/dt(fPARrec,i) fPARper,i d/dt(fPARper,i ) ETa,i d/dt(ETa,i) Pi d/dt(Pi) ETa,i-Pi d/dt(ETa,I-Pi) Irrigation EGU 2014 | Jorge Pena | Page 5
Random Forest Model • Training sample for each: average of 332 pixels (roughly 21 km2) • Model with 50% train/predict sample • ‘Pruning’ the tree • Covariance importance and optimisation • Observed agreement of 99%, kappa of 96% ‘Pruning’ Greenness Water use ‘Optimisation’ only 20 covariates ‘Covariate importance’ Irrigation | Jorge Pena| Page 6
Independent evaluation: maps and statistics Yearly basin-wide statistics Composite map of irrigated areas for 2004–2010 versus static map • Difference was less than 15% with some exceptions Irrigation | Jorge Pena | Page 7
Independent evaluation: areas and production Reported rice production Reported cotton irrigated areas Irrigation | Jorge Pena| Page 8
Independent evaluation: metered water withdrawals Summer rainfall, summer irrigation Winter rainfall, summer irrigation Water resource assessment | Jorge Pena| Page 9
Different outcomes when using all covariates Irrigation | Jorge Pena| Page 10
Global irrigation mapping: ETa development and evaluation Rolled-out globally at 5 km resolution, potentially at 500 m resolution. Evaluated at 500 m resolution against flux tower ETa located in 13 cropland and 22 grassland sites. Crops Water limited: Southern Italy Energy limited: The Netherlands Seasonally water limited: Nebraska, USA Grass • Flux tower evapotranspiration • Remote sensing evapotranspiration • Potential evapotranspiration Irrigation | Jorge Pena| Page 11
Conclusion • Accurate random forest mapping in a basin with extreme climatic variability and dissimilar irrigation practices • Inclusion of remotely-sensed ETa, P, and ETa-P enhanced the accuracy of the mapping • Summer irrigation in winter rainfall areas can be identified using greenness only during years with average rainfall. Irrigation | Jorge Pena| Page 12
Global irrigation mapping: potential covariates Irrigated Dryland Floodplain Irrigation | Jorge Pena| Page 14
Global irrigation mapping: covariates not depending on time of year Irrigated Dryland Floodplain Irrigation | Jorge Pena| Page 15
Global irrigation mapping: covariates not depending on time of year Irrigated Dryland Floodplain Irrigation | Jorge Pena| Page 16