Download
1 / 18
180 likes | 356 Views
Transverse size and distribution of FEL x-ray radiation of the LCLS. James L. Turner August 25, 2011. Introduction. Talk is about around 8keV hard xrays Measurement setup. Attenuation, Linearity, Backgrounds Simulation and Measurement of hard xray FEL spot before mirrors

E N D
Transverse size and distribution of FEL x-ray radiation of the LCLS James L. TurnerAugust 25, 2011
Introduction • Talk is about around 8keV hard xrays • Measurement setup. • Attenuation, Linearity, Backgrounds • Simulation and Measurement of hard xray FEL spot before mirrors • Microbunching and CSR • Size and divergence • Beam profile after the hard xray mirrors
Some LCLS reference points solid and gas attenuators SXR mirrors K-mono undulator vert. dump XPP YAG gas detectors Direct Imager YAG HXR mirrors Measurement point Simulation and measurement point Simulation point
Measurement Setup • YAG Intensity Profile Monitors • Attenuation camera and beam • Attenuating the beam with the materials we use requires care to not saturate the YAG while not attenuating enough fundamental to have a significant amount of 3rd harmonic. Typically 1-10% of beam intensity is allowed through. • High purity Be showed speckles, now we use diamond, sapphire, fused silica, and silicon.
Background Sources • Spontaneous radiation from the undulators (synchrotron radiation) • Electron beam is kicked transversely to suppress lasing, then background is acquired for later subtraction. • CSR (coherent synchrotron radiation) from the first bend in the final bend string which removes the electrons from the xray path. • 1 micron carbon filter is used on the beam path
Background Sources • Unknown uniform luminescence (possibly CSR bouncing off the walls, or gas detector florescence) • For gaussian hard xrays a “region of interest” can be cut where any uniform background will be baseline.
Saturation check Linearity check – pixel intensity sum vs. gas detector signal.
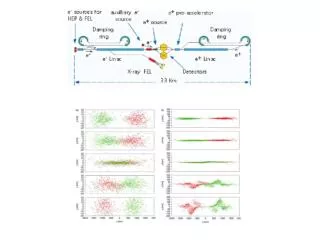
Simulation and Measurement Xrays from 250pC electron bunch (laser heater on and aligned) 8.3keV xray distribution, 3kA Left is Genesis simulation at end of undulator. Right is measurement at ~+90m. So, simulation is near field and measurement is far field. At ~1kA both are round (not shown).
Measurement Laser Heater On/Off Hard xrays from 150pC electron bunch, left is with Laser Heater on and well aligned. Right is Laser Heater off. Also compare on picture at 150pC to 250pC on previous slide.
Hard Xrays before Mirrors • Data • Turning down the number of electrons increases distribution uniformity • Turning down peak current increases distribution uniformity • Having laser heater on and aligned increases distribution uniformity • Conclusion • Likely CSR exacerbated by microbunching causing non-uniformity
Hard Xray Beam Size Quadrupole for matching into the undulator lattice is scanned around the match condition. Xray size minimizes at the match condition.
Slice Divergence Slice FWHM divergence measurement using slotted foil. Blue is the un-weighted mean, and Red is a weighted fitted line. Given the large errors due to fluctuations in the lasing of the slices, data is consistent with little or no divergence change along the beam. Divergence typically varies from 2-4 microradians FWHM.
After the Hard Xray Mirrors Two effects from hard xray mirrors are seen on intensity profile monitors after the mirrors, some interference lines come from cutting the beam, but by far the dominant effect is from the figure error.
Simulation: beam cut by hard xray mirrors Simulation of overfilling the mirrors, but no figure error is included. Projections on the left plot, blue to horizontal, red to vertical.
Hard xray mirror figure error The figure (millimeter to meter deviations) of the two LCLS hard xray mirrors. One is represented by the red, the other in blue. Vertical scale is in nanometers, horizontal is the length along the mirrors in millimeters.
Simulated and measured: hard xrays after mirrors Left is simulation including figure errors, right is measurement at XPP monitor (courtesy of David Fritz). There was some upstream clipping on the left side. Tic marks are 200microns apart for scale.
Summary Size and divergence measurements require care with backgrounds Measurements and simulations have agreement on non-gaussian profile generation. Measurement and simulations agree and show mirror figure errors have the dominant effect on beam shape. This makes nanometer level metrology and control very important for xfels.
LCLS – Spatial Fluctuations 200 um Thanks to David Fritz (LCLS XPP) Transverse size and distribution of FEL x-ray radiation of the LCLS