Download
1 / 57
770 likes | 1.38k Views
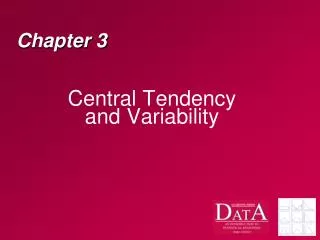
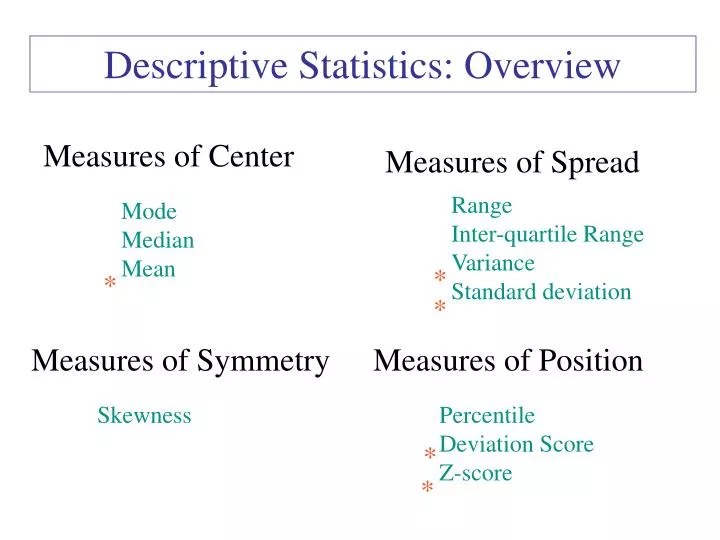
Measures of Spread. Measures of Center. Range Inter-quartile Range Variance Standard deviation. Mode Median Mean. *. *. *. Measures of Symmetry. Measures of Position. Skewness. Percentile Deviation Score Z-score. *. *. Descriptive Statistics: Overview. Central tendency.

E N D
Measures of Spread Measures of Center Range Inter-quartile Range VarianceStandard deviation Mode Median Mean * * * Measures of Symmetry Measures of Position Skewness Percentile Deviation ScoreZ-score * * Descriptive Statistics: Overview
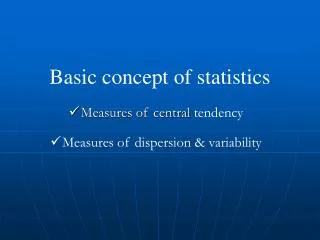
Central tendency • Seeks to provide a single value that best represents a distribution
Central tendency • Seeks to provide a single value that best represents a distribution • Typical measures are • mode • median • mean
For a given sample N=16: 33 35 36 37 38 38 38 39 39 39 39 40 40 41 41 45 The mode = 39 Mode • the most frequently occurring score value • corresponds to the highest point on the frequency distribution
For a given sample N=16: 33 35 36 37 38 38 38 39 39 39 39 40 40 41 41 50 The mode = 39 Mode • The mode is not sensitive to extreme scores.
For a given sample N=16: 34 34 35 35 35 35 36 37 38 38 39 39 39 39 40 40 The modes = 35 and 39 Mode • a distribution may have more than one mode
For a given sample N=16: 33 33 34 34 35 35 36 36 37 37 38 38 39 39 40 40 No unique mode Mode • there may be no unique mode, as in the case of a rectangular distribution
Median • the score value that cuts the distribution in half (the “middle” score) • 50th percentile For N = 15 the median is the eighth score = 37
Median For N = 16 the median is the average of the eighth and ninth scores = 37.5
For a sample: For a population: Mean • this is what people usually have in mind when they say “average” • the sum of the scores divided by the number of scores Changing the value of a single score may not affect the mode or median, but it will affect the mean.
__ 5 X=2.4 In order for the mean to be meaningful, the variable of interest must be measures on an interval scale. 4 3 Frequency 2 1 0 Jewish Muslim Catholic Buddhist Protestant Score Mean __ In many cases the mean is the preferred measure of central tendency, both as a description of the data and as an estimate of the parameter. X=7.07
__ __ X=36.8 X=36.5 __ X=93.2 Mean The mean is sensitive to extreme scores and is appropriate for more symmetrical distributions.
Symmetry • a symmetrical distribution exhibits no skewness • in a symmetrical distribution the Mean = Median = Mode
median mode mean Skewed distributions • Skewness refers to the asymmetry of the distribution • A positively skewed distribution is asymmetrical and points in the positive direction. Mode = 70,000$ Median = 88,700$ Mean = 93,600$ • mode < median < mean
median mode mean Skewed distributions • A negatively skewed distribution • mode > median > mean
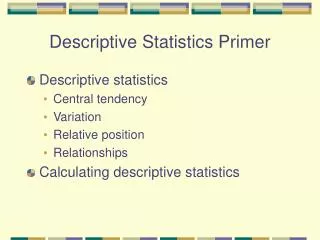
Distributions • Center: mode, median, mean • Shape: symmetrical, skewed • Spread
Measures of Spread • the dispersion of scores from the center • a distribution of scores is highly variable if the scores differ wildly from one another • Three statistics to measure variability • range • interquartile range • variance
Range • largest score minus the smallest score • these two have same range (80) but spreads look different • says nothing about how scores vary around the center • greatly affected by extreme scores (defined by them)
Interquartile range • the distance between the 25th percentile and the 75th percentile • Q3-Q1 = 70 - 30 = 40 • Q3-Q1 = 52.5 - 47.5 = 5 • effectively ignores the top and bottom quarters, so extreme scores are not influential • dismisses 50% of the distribution
Deviation measures • Might be better to see how much scores differ from the center of the distribution -- using distance • Scores further from the mean have higher deviation scores
Deviation measures • To see how ‘deviant’ the distribution is relative to another, we could sum these scores • But this would leave us with a big fat zero
Deviation measures So we use squared deviations from the mean This is the sum of squares (SS) __ SS= ∑(X-X)2
For a population: For a sample: Variance We take the “average” squared deviation from the mean and call it VARIANCE (to correct for the fact that sample variance tends to underestimate pop variance)
Variance • Find the mean. • Subtract the mean from every score. • Square the deviations. • Sum the squared deviations. • Divide the SS by N or N-1.
Standard deviation The standard deviation is the square root of the variance The standard deviation measures spread in the original units of measurement, while the variance does so in units squared. Variance is good for inferential stats. Standard deviation is nice for descriptive stats.
Example N = 28 X = 50 s2 = 140.74 s = 11.86 N = 28 X = 50 s2 = 555.55 s = 23.57
Measures of Center Measures of Spread Range Inter-quartile Range VarianceStandard deviation Mode Median Mean * * * * * * Measures of Symmetry Skewness Descriptive Statistics: Quick Review
Mean Variance Standard Deviation Descriptive Statistics: Quick Review For a population: For a sample:
Exercise • Treat this little distribution as a sample and calculate: • Mode, median, mean • Range, variance, standard deviation
Measures of Spread Measures of Center Range Inter-quartile Range VarianceStandard deviation Mode Median Mean * * * Measures of Symmetry Measures of Position Skewness Percentile Deviation ScoreZ-score * * Descriptive Statistics: Overview
How to describe a data point in relation to its distribution Measures of Position
Measures of Position Quantile Deviation Score Z-score
Divides ranked scores into four equal parts 25% 25% 25% 25% (median) (minimum) (maximum) Quantiles Quartile
Divides ranked scores into ten equal parts 10% 10% 10% 10% 10% 10% 10% 10% 10% 10% Quantiles Decile
Quantiles Percentile rank Divides ranked scores into 100 equal parts number of scores less than x Percentile rank of score x= • 100 total number of scores
Deviation Scores For a population: For a sample:
What if we want to compare scores from distributions that have different means and standard deviations? • Example • Nine students scores on two different tests • Tests scored on different scales
Z-Scores • Z-scores modify a distribution so that it is centered on 0 with a standard deviation of 1 • Subtract the mean from a score, then divide by the standard deviation For a population: For a sample:
Z-Scores A distribution of Z-scores… • Always has a mean of zero • Always has a standard deviation of 1 • Converting to standard or z scores does not change the shape of the distribution: z scores cannot normalize a non-normal distribution A Z-score is interpreted as “number of standard deviations above/below the mean”
Exercise On their third test, the class average was 45 and the standard deviation was 6. Fill in the rest.
Standard Deviation Descriptive Statistics: Quick Review For a population: For a sample: Mean Variance Z-score
Messing with Units • If you add or subtract a constant from each value in a distribution, then • the mean is increased/decreased by that amount • the standard deviation is unchanged • the z-scores are unchanged • If you multiply or divide each value in a distribution by a constant, then • the mean is multiplied/divided by that amount • the standard deviation is multiplied/divided by that amount • the z-scores are unchanged