Download
1 / 36
360 likes | 499 Views
Mississippi State. UNIVERSITY. CAVS. Center for Advanced Vehicular Systems. EXTENSION. Lean Sigma’s “Myth Buster” Introduction to 2 2 Factorial Design of Experiments. Clay Walden, Ph.D. Conference on High Technology Mississippi Telcom Center, Jackson, MS November 28, 2007.

E N D
Mississippi State UNIVERSITY CAVS Center for Advanced Vehicular Systems EXTENSION Lean Sigma’s “Myth Buster” Introduction to 22 Factorial Design of Experiments Clay Walden, Ph.D. Conference on High Technology Mississippi Telcom Center, Jackson, MS November 28, 2007
Myth Buster Can you distinguish truth from myth? • Only two Coca-Cola executives know Coke’s secret formula – each one only knows half. • A light bulb in 1901 burns bright to this day. • Pull tabs from aluminum cans have special redemption value for time on kidney dialysis machines • Great Wall of China is the only man made object visible from the moon. • In order to implement Six Sigma you need to hire a pointed head statistician.
Myth Buster “Pretest” Can you distinguish truth from myth? • Only two Coke-Cola executives know Coke’s the secret formula – each one only knows half. • Pull tabs from aluminum cans have special redemption value for time on kidney dialysis machines • Great Wall of China is the only man made object visible from the moon. • A light bulb in 1901 burns bright to this day. • In order to implement Six Sigma you need to hire a pointed head statistician • Myth • Myth • Myth • Truth • ????
Pre-Test Evaluation • 0-1 Correct: Give Up! • 2-3 Correct: Recommend enrolling in next “1 sigma” pink belt workshop. • 4 Correct: Need to find a life outside of watching “Myth Buster” reruns
Shop Floor Myths • Like popular culture – “myths” and urban legends abound on the shop floor. • Why?
Shop Floor Myths • Like popular culture – “myths” and urban legends abound on the shop floor. • Why? • Dynamic and sometimes chaotic environment • Lots of possible factors – Deming stable processes are an achievement and NOT a natural state. • Inadequate measurement systems • “Shoot from the hip & declare victory” approach to problem solving.
Generic Myths • If parts are “in spec” then problem is NOT in manufacturing. • If parts are “out of spec” then we have found the root cause of our field failures. • We have excellent communications between shifts. • Our workforce will always be generally unskilled and unmotivated. • All tasks and operations are equally important. • …. • ….
+ + + + Hire a statistician ! How can we dispel these and other manufacturnig myths? EASY BUTTON
Multiple Factor Approach • Assemble “experts” and thoroughly discuss the candidate factors. • Engineering • Maintenance • Operations • Good Opportunity for Cause and Effect diagram (Fishbone) • Use a group consensus technique like multi-voting to find the top “few” factors, at least from the team’s perspective. • Each person has $100 to “spend” on the factors in order of their importance. • Very successful in building group consensus. • Always do a “sanity check” never “blindly” follow the approach. Good subject matter experts are essential, not just engineers.
Now what do you do ? • Most industrial settings, interested in making conclusions regarding multiple factors. • Trial and Error • Typical “OFAT” Approach • very carefully vary one factor at a time so that we can isolate the impact of each. • Any problems? • DOE is a better way … Why?
Example Problem Measurement Method Machine • Problem: Gas mileage for car is 20 mpg. Would like to get >30 mpg. • Factors: Driving habits New tires Gage Error Tire pressure Speed MPG Type of Gas Type of Gas Driving habits weather New driver Materials Man Mother Nature
“One Factor @ a Time” • Inefficient use of sample size. • Interactions can not be investigated.
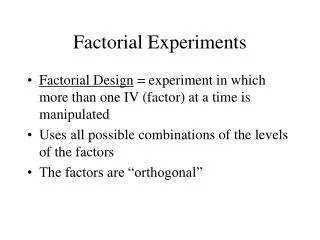
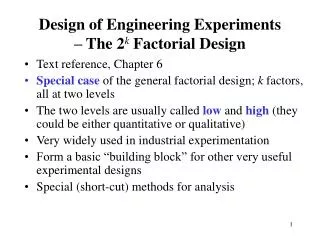
Power of 22 Factorial Design Factorial Design – each level of one factor is found in combination with each level of the other factors. Allowing both Main Effects and Interactions to be estimated
Interactions? • Interactions occur when the effect of one factor depends upon the level of another factor. • Example, Drug “A” reduces blood pressure when used by itself, Drug “B” reduces anxiety when used by itself. If Drug A and B are used together may lead to a heart attack or stroke.
Interactions • Are understanding interactions important to improving manufacturing processes? Yield of a chemical process is impacted by operating temperature and reaction time. The impact of changing temperature on yield depends upon the reaction time.
22 Factorial Example – Main Effect Objective: two factor experiment focusing on the impact of hardness and lubrication on process yield (%). Main Effects: Effect of Hardness (A): average change in response (yield) as hardness goes from a low to high level. Effect of Lubrication (B): average change in response (yield) as lubrication goes from a low to high level.
22 Factorial Example Main Effects: Main Effect of A: A = (30+40)/2 – (10+20)/2 = 20 Main Effect of B: B = (20+40)/2 – (10+30)/2 = 10 Interaction AB: AB = (40+10)/2 – (30+20)/2 = 0 Notice: the effect of A is the same no matter what the level of B. This indicates there is no interaction effect.
50 Lub “high” 40 Yield 30 Lub “low” 20 10 “low” Hardness “High” Hardness Plot of Effects – Main Effect Parallel lines indicate the absence of an interaction effect Effect of hardness on yield is the same regardless of whether clean or dirty lub is used.
22 DOE Example - Interaction Changed response from 40, notice impact on effects calculation and effects plot.
Plot of Effects - Interaction 50 40 Yield 30 Lub “low” 20 10 Lub “high” “low” Hardness “High” Hardness Intersecting lines indicate an interactive effect. Effect of hardness on yield depends on whether you are using clean or dirty lub.
Myths – “Small Motor Plant” • “Our new rpm/amps tester provides us with a reliable evaluation of product performance.” • “Use a special “calibrated” rubber hammer to reduce shaft TIR. • “Current Method of aligning commutator, while not perfect, is adequate.” • “Reason for the 40% failure rate must be in the ancient heat treating process. We can’t solve the problem, because the company is unwilling to invest.” – Catalogue Engineer (Shigeo Shingo)
Myths Busted … “Small Motor Plant” • Exposed by … • Measurement System Analysis • Cyclical error found which takes up 50% of tolerance • Design of Experiment on the Shop Floor – 23 factorial 40 runs (1 day) • “Rubber Hammer” process not capable • Tested new alignment method verses “old method” • Resulted in … • Reducing defect rate from 40% to 0% • ~ $500K per year in savings
Myths – Acme Tube & Pipe • “Any combination of plugs and dies from the tool crib will work.” • “A high degree of variation in tube eccentricity at the press is inherent.” • “We need to better train our operators and maintenance personnel to repair “breakers” quicker.”
Busted … Acme Tool & Tube • Exposed by … • Design of Experiment on the Shop Floor – factorial (2 day) • Lub ID critical • Match correct “plug and die” • Standardized work and 5S in tool crib • Resulted in … • Reducing “breaker rate” from 12% to 5% • $2,700,000 per year in savings
Catapult Dynamics Producing our nation’s next generation of missile defense systems! CTQ: Range: Target: 75” Specification: +/- 1”
Catapult Factory • Use 6 Sigma Problem Solving Approach • DMAIC • Objective reduce process variation and center on target (75 inch). • Plant Resources • Personnel: 3 operators, 1 inspector, 1 Recorder • Equipment: ping pong balls, tape measure, pad, pen.
Myth or Truth?Catapult Dynamics • Variation caused by repeated use of the rubber band is unavoidable. • Production task is quite simple and should be automated. • Poorly skilled and unmotivated workforce • If the company really cared about quality they would invest in a new highly automated CNC catapult. • Testing can best be done when only factor is changed at a time. ….
Design of Experiments • Select two key factors • each factor at 2 levels. • Replicate the experiment • 8 runs are required – which ones? • “Randomize the trails” (why?) • Analyze the results (i.e., plot the data) • Make recommendations for standard work within the process.
Plot of Effects - Interaction 50 Factor B “high” 40 Response 30 20 Factor B “low” 10 “low” Factor A “High” Factor A The effect of Factor A on distance depends upon the level of factor B.
Plot of Effects – Main Effects 50 40 Response 30 Factor B “low” 20 Factor B “high” 10 “low” Factor A “High” Factor A The effect of Factor A on distance does not depend upon the level of factor B.
Plot of Effects 90 Factor B “low” 80 Response 70 60 Factor B “high” 50 “Low” Factor A “High” Factor A
Key Take-a-Way Catapult Dynamics
+ + + + Myth: You must hire a pointed head statistician to use Six Sigma Busted !