Download
1 / 14
140 likes | 223 Views
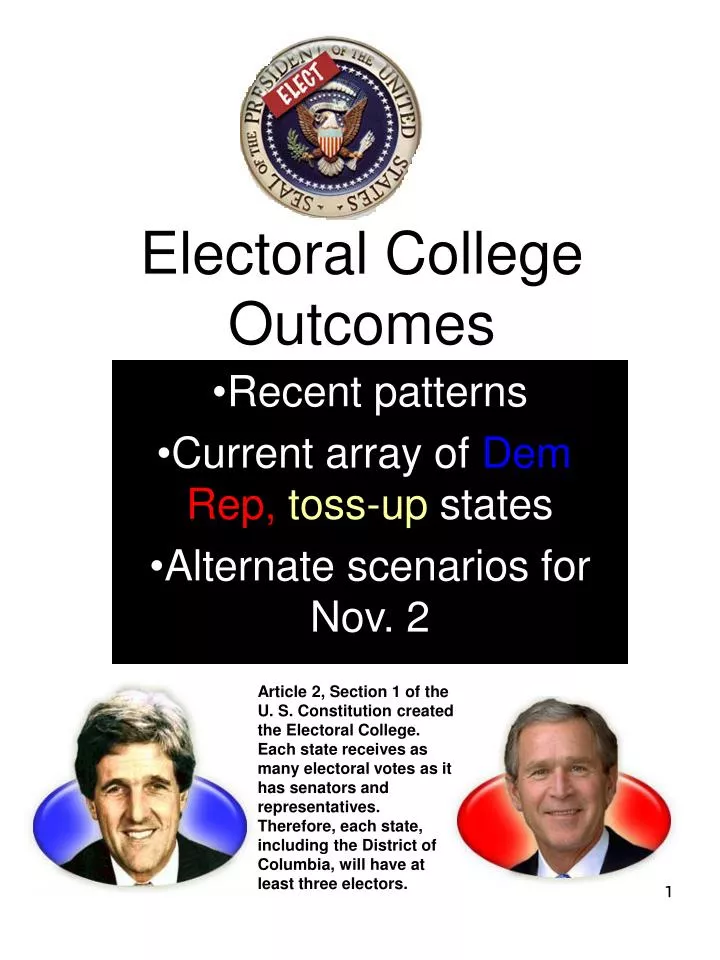
Electoral College Outcomes. Recent patterns Current array of Dem , Rep, toss-up states Alternate scenarios for Nov. 2.

E N D
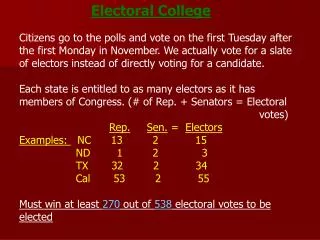
Electoral College Outcomes Recent patterns Current array ofDem, Rep,toss-upstates Alternate scenarios for Nov. 2 Article 2, Section 1 of the U. S. Constitution created the Electoral College. Each state receives as many electoral votes as it has senators and representatives. Therefore, each state, including the District of Columbia, will have at least three electors.
Recent patterns: Bush/Dukakis - 1988 Republicans win big EC: Bush 426 (79%), Dukakis 111 (21%) Votes: Bush – 48,886,097 (53.9%) Dukakis – 41,809,074 (46.1%) Total votes: 90,695,171 Reps=blue, Dems=Red
Recent patterns: Clinton/Dole -1996 Democrats win big in 1996 EC: Clinton 379 (70%), Dole 159 (30%) Votes: Clinton - 47,402,357 (49%); Dole 39,198,755 (41%); Perot – 8,085,402 (8%) 92,686,514 total votes
Recent patterns: Gore/Bush 2000 No one wins big EC: Bush 271 (50.4%), Gore 266 (49.6%) Vote: Bush – 50,456,002 (48.4% Gore – 50,999,897 (48.9%) Nader – 2,882,955 (2.8%) Total Votes: 104,338,854
2004 – General Pattern:of EC Votes:Rep (Red),Dem (Blue)and Toss-up(White)States
Distribution of Electoral College Votes – Current Distribution and Democratic “Sure” States (>5%) • Current distribution • Changes since 2000 – Dem sure states lost 3 EC votes • Total 183 but only 179 if Kerry loses Hawaii
Distribution of EC Votes: Democrat “Leaning” States (2.5-5%) • Changes since 2000: Dem leaning states lose 4 EC votes • Total 65 • Total blue sure and leaning 183+65=248 • Minus (Hawaii): 244 (need 36 votes)
Distribution of EC Votes: Rep “Sure” States, 5%+ • Changes since 2000 -Rep states gain 3 EC votes • Total 217
Distribution of EC Votes: Republican “Leaning” States • Changes since 2000: Rep leaning states gain 0 EC vote • Total 5 • Total Rep sure and leaning 217+5=222 • Add Hawaii: 226 (need 44 votes)
Distribution of EC Votes: “Toss-up” States (-2% to +2%) Changes since 2000: Toss-up states gain 2 EC votes Total 68
1st Scenario Bush Wins “Big” Assumptions: • Wins all Rep sure states = 217 • Wins all Rep leaning and Hi=9 • Wins all toss-up states =68 • Wins Minn. and Michigan =27 • Total Bush: 321
2nd Scenario Bush Wins “Small” Assumptions: • Wins all Rep states = 217 • Wins Rep leaning =5 • Wins all toss-up states=68 • Total Bush: 276 • Total Bush win range: 276-321
4 Scenarios Kerry Wins “Small” • Assumptions: • Wins all Dem sure states except Hi = 179 • Wins all Dem leaning=65 • Wins one large toss-up state =Florida=27 • OR: wins Ohio (20) +Iowa (7) =27 • Total Kerry: 271
4th Scenario Kerry Wins “Big” • Assumptions: • Wins all Dem sure states including Hi = 183 • Wins all Dem leaning states = 65 • Wins all toss-up states =68 • Total Kerry: 316 • Total Kerry win range: 271-316