Download
1 / 10

E N D
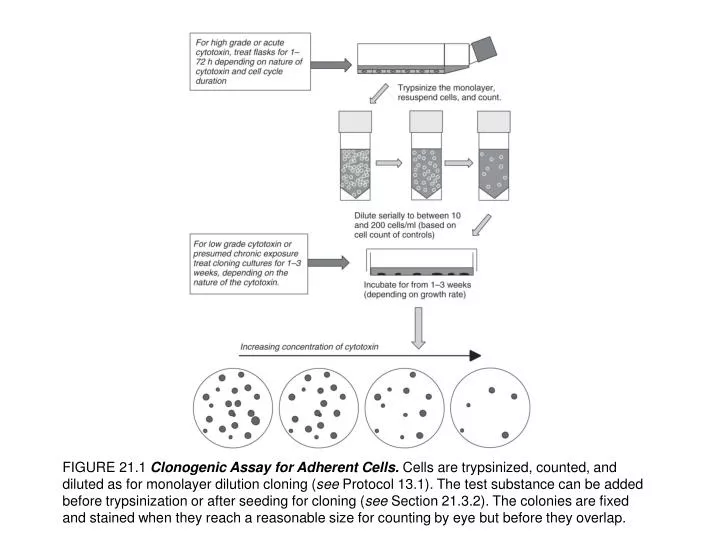
FIGURE 21.1 Clonogenic Assay for Adherent Cells. Cells are trypsinized, counted, and diluted as for monolayer dilution cloning (see Protocol 13.1). The test substance can be added before trypsinization or after seeding for cloning (see Section 21.3.2). The colonies are fixed and stained when they reach a reasonable size for counting by eye but before they overlap.
FIGURE 21.2 Survival Curve. Semilog plot of the surviving fraction of cells (ratio of colonies forming from test cells to colonies forming from control cells) against the concentration of cytotoxin. Typically the curve has a ‘‘knee,’’ and the IC90 lies in the linear range of the curve. The IC50, falling on the knee, is a less stable value.
FIGURE 21.3 Interpretation of Survival Curves. Semilog plot of cell survival against the concentration of cytotoxin. The slope increases with increasing sensitivity and decreases with reduced sensitivity until it becomes totally flat for complete resistance. Partial resistance as a resistant fraction is shown by the curve flattening out at the lower end.
FIGURE 21.4 Effect of Culture Conditions on Survival. (a) Cell density. Human glioma cells were plated out in the presence (dashed line) and absence (solid line) of a feeder layer after treatment with various concentrations of 5-fluorouracil. A 10% resistant fraction is apparent at 1 X 10⁻⁴ M drug only in the presence of a feeder layer. In the absence of the feeder layer, the small number of colonies making up the resistant fraction were unable to survive alone. (b) Medium constituents. High serum medium (HSM; solid line and squares) compared with HSM without serum (dashed line and circles) shows about a 5-fold increase in the IC50 with serum; removing cysteine decreases the IC5010-fold (data from [Nilsson et al., 1998]).
FIGURE 21.5 Microtitration Assay. Stages in the assay of two different cell lines exposed to a range of concentrations of the same drug and then allowed to recover before the estimation of survival by the MTT reaction (see Protocol 21.4). The far left column has no cells and can be used as a blank to set the plate reader. This array is applicable when using plate sealers, when all wells are equivalent; however, with lids, there is a risk of an edge effect, probably due to evaporation, and it is better to leave the far left and far right columns blank (i.e., with medium only, as in Protocol 21.4), and some users leave the top and bottom rows blank as well. (See also Plate 17b).
FIGURE 21.6 Percentage Inhibition Curve. Test well values are calculated as a percentage of the controls and plotted against the concentration of cytotoxin. Typically a sigmoid curve is obtained, and ideally the IC50 will lie in the center of the inflexion of the curve.
FIGURE Assay Duration. Pattern for short-form and long-form assays. The upper diagram represents an assay that is suitable for cell with a PDT < 24 h, and the bottom diagram represents an assay that is suitable for cells with a PDT > 24 h, although intermediate time scales are also possible.
FIGURE 21.8 Time Course of the Fall in IC50. Idealized curve for an agent with a progressive increase in cytotoxicity with time, but eventually reaching a maximum effect after three cell cycles. Not all cytotoxic drugs will conform to this pattern [Freshney et al., 1975].
FIGURE 21.9 Correlation between Microtitration and Clonogenic Survival. Measurement of the IC50 values of a group of five cell lines from human glioma and six drugs (vincristine, bleomycin, VM- 26 epidophyllotoxin, 5-fluorouracil, methyl CCNU, mithramycin). Most of the outlying points were derived from one cell line that later proved to be a mixture of cell types. The broken line is the regression, with the data points from the heterogeneous cell line omitted. Microtitration IC50 was derived by [35S]methionine incorporation [Freshney & Morgan, 1978; figure after Freshney et al., 1982a].
FIGURE 21.10 Organotypic Assay. Assay system for exposing one cell layer (e.g., epidermal keratinocytes) cocultured with another associated cell type (e.g., skin fibroblasts in collagen gel; see Plate 20) to an irritant and measuring the response by cytokine release (see also Plate 21).