Download
1 / 25
250 likes | 387 Views
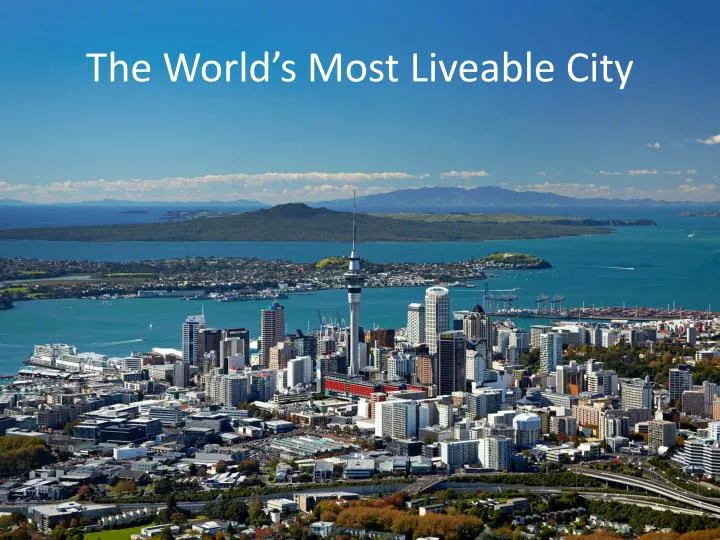
The World’s Most Liveable City. “ D espite the technological breakthroughs that have caused the death of distance, it turns out that the world isn’t flat, it’s paved. The city has triumphed” Glaeser , 2010. Liveable for who? Largest New Zealand regions. Source: Statistics New Zealand.

E N D
“Despite the technological breakthroughs that have caused the death of distance, it turns out that the world isn’t flat, it’s paved. The city has triumphed” Glaeser, 2010
Liveable for who? Largest New Zealand regions Source: Statistics New Zealand
An additional person every … Source: Statistics New Zealand, Auckland Council calculations
The lure of Auckland . . . Source: Statistics New Zealand
Regional GDP per capita in Asia-Pacific region North Island = 56th South Island = 64th Source: OECD Regions at a Glance 2011
The GFC and GDP per capitaAuckland real GDP per capita Year to Sep. 2012: Auckland GDP per capita = $50,200 $7,100 gap Source: Statistics NZ, Infometrics
Our economic targets: A 6% PLUS INCREASE IN REGIONAL EXPORTS A 5% PLUS INCREASE IN REAL GDP - A 5% PLUS INCREASE IN REAL GDP A 2% PLUS INCREASE IN PRODUCTIVITY GROWTH
Unemployment rate Auckland & New Zealand Year to Dec. 2012: Auckland 7.7% RoNZ 6.5% NZ Treasury forecasts: 2013 5.8% 2014 5.3% 2015 5.0% 4.7% Source: Statistics New Zealand
Unemployment by qualification Auckland, annual average Source: Statistics New Zealand
International competitiveness The 2010/11 Global Competitiveness Report highlighted inadequate infrastructure as the biggest problem facing businesses in New Zealand
Aotea Station Under Albert St between Victoria & Wellesley streets 18 metres underground Entries on Wellesley & Victoria streets City Rail Link Stations & Parnell Parnell Station Near Mainline Steam Opens Sept. 2012 Access to Parnell & University Newton Station Under Symonds St between Newton Rd & Mt Eden Rd 43 metres underground Entries on Mt Eden Rd & Symonds St K Road Station Under Pitt St between Beresford Square & K Rd 35 metres underground Entry on Beresford Square
How short sighted are we?United Kingdom vs New Zealand approach • Long lived projects dramatically more viable
Auckland Productivity PremiumThe geography of economic activity matters Source: MOTU
“A material measure of wellbeing such as GDP … is an insufficient index for measuring aggregate wellbeing” Grimes, 2012
“The top 1 percent gained 93 percent of the additional income created in the country in 2010” Joseph Stiglitz, 2012
Wealth/Jobs • Transport • Environment • Inequality • Sustainable future