Download
1 / 17
170 likes | 362 Views
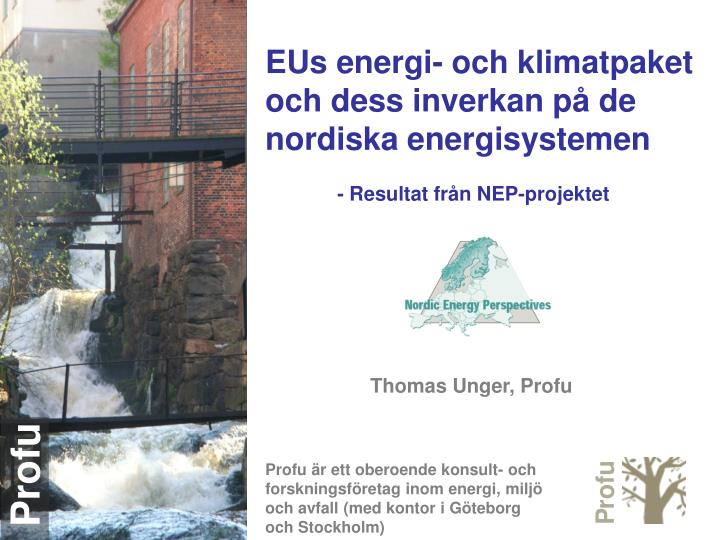
EUs energi- och klimatpaket och dess inverkan på de nordiska energisystemen - Resultat från NEP-projektet Thomas Unger, Profu. Profu. Profu är ett oberoende konsult- och forskningsföretag inom energi, miljö och avfall (med kontor i Göteborg och Stockholm).

E N D
EUs energi- och klimatpaket och dess inverkan på de nordiska energisystemen - Resultat från NEP-projektet Thomas Unger, Profu Profu Profu är ett oberoende konsult- och forskningsföretag inom energi, miljö och avfall (med kontor i Göteborg och Stockholm)
The EU energy- and climate-policy targets (”20-20-20 until 2020”) For the EU as a whole: • Reduce GHG emissions by 20% until 2020 compared to 1990 • CO2 in ETS-sector 21% by 2020 rel. 2005, • CO2 in non-ETS-sector 10% by 2020 rel. 2005 • Increase the share of renewables from 8,5% to 20% of total final energy use in 2020 • Reduce total energy use by 20% until 2020 compared to a baseline projection for 2020 • Significant impact on the Nordic energy systems that will affect most of the energy markets and sectors !
The NEP (Nordic Energy Perspectives) project www.nordicenergyperspectives.org • An interdisciplinary Nordic research project • Nordic focus in a European and global context • Four main research areas: • Markets and structures within the energy area • Development towards lower CO2 emissions and more renewables • Security of supply and energy resources (e.g. potentials for renewables) • Energy efficiency and resource management • Researchers from all four Nordic countries: e.g. VTT, VATT, EME Analys, ECON, Göteborgs Universitet, XRGIA, Profu, CHALMERS .. • Financiers from all four Nordic countries • Phase II : 2007-2010 (Phase I: 2005-2006)
-16% -17% -20% The EU CO2-reduction target for the Nordic countries (the ETS-sector and the non-ETS sector) The non-ETS sector (transports, res&comm, certain industries) • The ETS sector • (supply of elec+DH, • industry,) • No specific Nordic • target but an all-European commitment • of reducing CO2 emissions by 21% by • 2020 comprd. to 2005 • CO2-price assumptions (e.g. 20-40 EUR/t) CO2-reduction by 2020 comprd. to 2005
The renewable Directive and its target levels for the Nordic countries In the base case, we assume: +130 TWh in the stationary system + 30 TWh in transports (= biof.-Dir) until 2020 (comprd. to 2005) for the Nordic countries as a whole +10% +9% Norway included through the EEA agreement +10% +9% +13%
The scenarios of the ”EU 20-20-20” analysis • Reference scenario Existing policy instruments (incl 25 EUR/t, which we assume fulfills the CO2 target for the EU in 2020) • How far do we reach towards our ”Nordic goals” with existing policy measures? • ”Green Package” scenario Existing policy instruments+Renewable target according to EU Directive (+160 TWh renewable energy (final) including transports in the Nordic countries as a whole; Biofuel Directive in transports + ~30TWh) • ”Extended green package” scenario As ”Green Package” but INCLUDING increased energy efficiency with 20 % in the Nordic countries as a whole (Biofuel Directive + ~1,7 million EVs in transports → Transports take their efficiency-target share)
If all ”20%-targets are implemented, total CO2 reductions may approach 30% by 2020 !! ”Business-as -usual” (no add. policy. instr.) ”EU-20-20” by 2020 ”EU-20-20-20” by 2020 If all ”EU 20%-targets” are implemented, total CO2 reductions may approach 30% by 2020 !!
Reductions are mainly carried out in the stationary energy sector (up to 25% of total in 2005) 2020 emissions in different scenarios Transports in 2005: ~30% of total Stat. energy in 2005: ~70% of total
The impact on renewables (+ 160 TWh in tot by 2020) - The ”Green Package” scenario Increase in the use of renewables compared to 2007 +~160 TWh
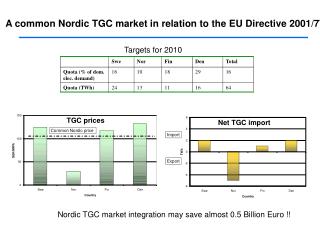
Förnybarhetsdirektivet kan väsentligt ändra den nordiska elbalansen gentemot Kontinentaleuropa Utan europeisk handel inom förnybarhets- direktivet kan vi få en nettoexport på ~10-15 TWh till 2020 ... Nordisk nettoimport Nordisk nettoexport
…men med EU-handel inom det förnybara direktivet Ytterligare ökad elexport från Norden (~25-30 TWh) Diff: 25-30 TWh
The increase of renewables by 2020 (”Green package” scenario, country-by-country) Roughly 50-60% of the increase occurs in supply of electricity and district heating
The impact on renewables - All scenarios (2020) Biofuel Directive Biofuel Directive + ~1.7 million EVs
Hur uppnå 20% effektivisering samfällt i Norden? - modellresultat plus kompletterande analys på energianvändningssidan Effektiviseringsåtgärder i el- och fjärrvärmeproduktionen: < 5% Åtgärder: KK → Vind, gaskraft,.. Konverteringar i bostäder, lokaler och industrin: > 5% Åtgärder: KK→Elbesparingar,.. Effektiviseringsåtgärder i bostäder, lokaler och industrin: ca 10% Primärenergiviktning = 1 för kärnkraft Primärenergiviktning = 3,3 för kärnkraft
Inbromsning av fjärrvärmen i Norden? - Kan förstärkas av effektiviseringsmålet PJ 15 10 5 Källor: Sweden: Energimyndigheten, Prognoser för utsläpp och upptag av växthusgaser, Fjärrsynprojekt 2009 Denmark: Energistyrelsen, Fremskrivning af Danmarks energiforbrug og udledning af drivhusgasser frem til 2025 Finland: Ministry for Employment and the Economy Norway: Enova
A large span in electricity-price development - but generally a stabilization at 40-50 EUR/MWh The shaded area indicates the interval of the main part of the model runs (including all models of the NEP project) Until May 2009
Important conclusions so far • The EU energy and climate package will significantly affect and involve all • sectors • The different EU goals may affect the energy markets in different/opposite ways • Total Nordic CO2 emissions may be reduced by ~ 30 % by 2020 (comprd • to 2005) if the three EU goals are implemented • Nordic electricity supply almost CO2-free by 2020 (nuclear, renew. but hardly • CCS…) if EU targets are met (fossil share: ~5-10% of total supply) • Energy-efficiency goal seems to dominate: most expensive and tends to ”solve” also the other two goals • Energy-efficiency goal tends to dampen the increase in renewables (in absolute numbers) and to reduce the use of DH and electricity • Trade-off between different sectors, e.g. ETS and non-ETS or heating market and electricity market Important flexibility Goals should not be too sector-specific ! Much more at www.nordicenergyperspectives.org !!!