Download
1 / 32
340 likes | 617 Views
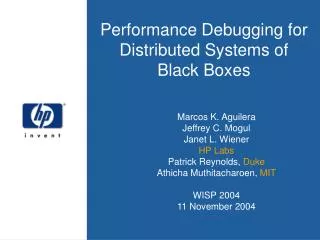
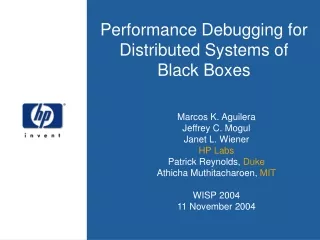
Proceedings of the Nineteenth ACM Symposium on Operating Systems Principles (SOSP), 2003. Performance Debugging for Distributed Systems of Black Boxes. Marcos K. Aguilera, Jeffrey C. Mogul, Janet L. Wiener, Patrick Reynolds and Athicha Muthitacharoen Jihye Yun and Seohyun Kwak. Contents.

E N D
Proceedings of the Nineteenth ACM Symposium on Operating Systems Principles (SOSP), 2003 Performance Debugging for Distributed Systems of Black Boxes Marcos K. Aguilera, Jeffrey C. Mogul, Janet L. Wiener, Patrick Reynolds and Athicha Muthitacharoen Jihye Yun and Seohyun Kwak
Contents • Introduction • Overview of Approach • Algorithms • Nesting Algorithm (RPC) • Convolution Algorithm (free-form) • Experimental Results • Conclusions
Contents • Introduction • Overview of Approach • Algorithms • Nesting Algorithm (RPC) • Convolution Algorithm (free-form) • Experimental Results • Conclusions By Jihye Yun
Introduction • Distributed systems that are composed of “black-box” components are hard to debug • Goal of this paper is to design tools enabling to isolate performance bottlenecks in black-box distributed systems • Approach based on application-independent passive tracing of communication between nodes in distributed system, and combined offline analysis of these traces
Problem • An external request to system causes activities in graph along a causal path • Assume that all latencies in such a system can be ascribed to node traversals client client client client client web server web server web server A series of node traversals where each traversal is caused by some message from a prior node on path application server application server authentication server database server database server database server database server Tools and methodologies to understand sources of latency in distributed system
Goals • Isolate performance bottlenecks • Find high-impact causal path patterns • High-impact: occur frequently, and contribute significantly to overall latency • Identify high-latency nodes on high-impact patterns • Add significant latency to these patterns • Make tools broadly applicable to systems of black-box components • Require minimal knowledge and no modification of applications, middleware, messages or workloads • Not significantly perturb system performance
Overview of Approach • Rely on tracing messages between nodes • Challenges • Real trace contain interleaved messagesfrom many causal paths • Want only statistically significant causal paths
Overview of Approach • Exposing and tracing communication (online) • Gather complete trace of all inter-node messages • Inferring causal paths and patterns (offline) • Post-process trace using one of several algorithms • Visualization • Provide appropriate ways to visualize results How obtain individual messages without perturbing system How convert messages to concise trace How manage and store large amounts of trace data
Algorithms • Two distinctly different algorithms for inferring causal path patterns and latencies from relatively simple message traces • Nesting algorithm • Depend on use of RPC-style communication • Operate on individual messages in trace • Convolution algorithm • Handle free-form message-based communication • Use signal-processing technique to extract causal information from traces
Nesting Algorithm • Infer causality from nesting relationships by message timestamps • Roughly linear (in time and space) in size of trace • However, require RPC-style communication (Messages are calls and returns)
Nesting Algorithm • Find call pairs in trace • (A, B, 1, 11), (B, C, 3, 5), (B, D, 7, 9) • Find and score all nesting relationships • (B, C, 3, 5) nested in (A, B, 1, 11) • (B, D, 7, 9) also nested in (A, B, 1, 11) • Pick best parents • Derive call paths • ABC;D (call) (return)
Nesting Algorithm • Find call pairs in trace procedure FindCallPairs for each trace entry (t1, CALL/RET, sender A, receiver B, callid id) case CALL: store (t1, CALL, A, B, id) in Topencalls case RETURN: find matching entry (t2, CALL, B, A, id) in Topencalls if match is found then remove entry from Topencalls update entry with return message timestamp t2 add entry to Tcallpairs entry.parents := {all callpairs (t3, CALL, X, A, id2) in Topencalls with t3 < t2} Based on packet header information Match call and return trace entries into call pairs using hash table Identify all possible parents for each call pair
Nesting Algorithm • Find and score all nesting relationships • Number of histograms is equal to number of (A, B, C) triples • This number, which is independent of trace length, is at most n3, for n nodes (call) (call) node A node B node C procedure ScoreNestings for each child (B, C, t2, t3) in Tcallpairs for each parent(A, B, t1, t4) in child.parents scoreboard[A, B, C, t2- t1] += (1/|child.parents|) t1 (return) (return) t2 t3 t4 Histogram of delays between two call messages in potentially-causal nesting
Nesting Algorithm • Find and score all nesting relationships • Example of parallel calls t3-t1 t4-t2 t3-t2 t4-t1 1 2 Possible sets of parent-child pairings 1357 : t3-t1 1467 : t4-t1 2358 : t3-t2 2468 : t4-t2 3 5 4 6 7 8
Nesting Algorithm • Pick best parents procedure FindNestedPairs for each child (B, C, t2, t3) in Tcallpairs maxscore := 0 for each p (A, B, t1, t4) in child.parents score[p] = scoreboard[A, B, C, t2- t1]∙penalty if(score[p] > maxscore) then maxscore := score[p] parent := p parent.children := parent.children ∪ {child} Using # of children already assigned to given parent Overlapping-child penalty Generic-child penalty Same-child penalty
Nesting Algorithm • Derive call paths procedure FindCallPaths for each callpair (A, B, t1, t2) if callpair.parent = фthen root := new path starting at A root.edges := { CreatePathNode(callpair, t1) } if root is in Tpathsthen update its latencies else add root to Tpaths procedure CreatePathNode(callpair (A, B, t1, t4), tp) node := new node with name B node.latency:= t4 – t1 node.call_delay := t1 – tp foreach child in callpair.children node.edges := node.edges ∪{ CreatePathNode(child, t1) } return node
Nesting Algorithm • Infer causality from nesting relationships by message timestamps • Time complexity: O(mp) • m = # of messages • p = mean of per-node parallelism • However, require RPC-style communication
Contents • Introduction • Overview of Approach • Algorithms • Nesting Algorithm (RPC) • Convolution Algorithm (free-form) • Experimental Results • Conclusions By Seohyun Kwak
Convolution Algorithm • Consider the aggregation of multiple messages • Convert traces into time signals and use signal processing techniques to find correlation btw messages • Can be used on traces of free-form message-based communication, not just RPC-style traces
Convolution Algorithm • A sent message to B at times 1,2,5,6,7 time 1 2 3 4 5 6 7 S1(t)= AB messages
Convolution Algorithm • Look for time-shifted similarities • Compute convolution X(t) = S2(t) S1(t) • Use Fast Fourier Transforms S1(t) (AB) S2(t) (BC) Peaks in X(t) suggest causality between AB and BC X(t) Time shift of a peak indicates delay
Convolution Algorithm • Spike • Result has a spike at position d if and only if s2(t) contains a copy of s1(t) time-shifted by d. • X-axis represents the time shift • Y-axis roughly estimates the number of messages matching a given shift
Convolution Algorithm • Time complexity: O(em+eSlogS) • m = # message • e = # edge in output graph • S = # time steps in trace • Need to choose time step size • Must be shorter than delays of interest • Too coarse: poor accuracy • Too fine: long running time • Robust to noise in trace • Run-time is dependent on the trace duration and time-quantum, not the trace length
Algorithm comparison • Nesting • Looks at individual paths and then aggregates • Finds rare paths • Requires call/return style communication • Fast enough for real-time analysis • Convolution • Applicable to a broader class of systems • Slower: more work with less information • May need to try different time steps to get good results • Reasonable for off-line analysis
Summarize Nesting Algorithm Convolution Algorithm Communication style RPC only RPC or free-form messages Rare events Yes, but hard No <timestamp, sender, receiver> + call/return tag Level of Trace detail <timestamp, sender, receiver> Time and space complexity Linear space Linear time Linear space Polynomial time Visualization RPC call and return combined More compact Less compact
Visualization of results • Nesting algorithm • Convolution algorithm
Experiments : generated traces • Used a trace generator to simulate a distributed system • Nesting algorithm Infer causal path and delay of each edges and nodes
Experiments : generated traces • Used a trace generator to simulate a distributed system • Convolution algorithm
Accuracy Trace parallelism Delay variation Message drop rate
Future work • Cannot detect rare events • Solved by employing sliding window • Detect frequent only in a short time interval • Analyzing with real system is needed • Merge similar paths from nesting algorithm to from a single visualization of the system