Download
1 / 33
330 likes | 472 Views
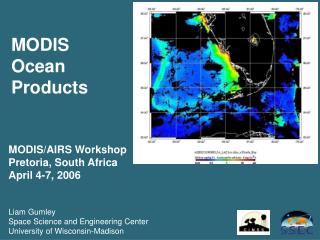
MODIS Imagery and Products in an Operational Forecasting Environment. Jordan Joel Gerth Cooperative Institute for Meteorological Satellite Studies and Space Science and Engineering Center University of Wisconsin at Madison Wednesday, November 1, 2006. Overview. Participating Offices

E N D
MODIS Imagery and Products in an Operational Forecasting Environment Jordan Joel Gerth Cooperative Institute for Meteorological Satellite Studies and Space Science and Engineering Center University of Wisconsin at Madison Wednesday, November 1, 2006
Overview • Participating Offices • AWIPS D-2D • Types of Imagery and Products • Processing and Delivery Mechanism • Hurdles • Most and Least Used • Strengths and Weaknesses • Value to Forecaster
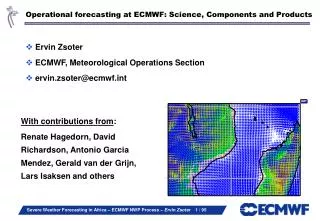
Overview • There is an ongoing two-pronged effort in support of providing MODIS data to the National Weather Service: • MSFC SPORT project - Short-term Prediction Research and Transition Center whose goal is to use NASA Earth Science Enterprise (ESE) observations to improve short term (0-24hr) forecasts. They are using University of Wisconsin-Madison DB MODIS and AMSR-E products for distribution to forecast offices in the Southern Region. • UW-Madison - Supporting NWS MODIS Direct Broadcast data delivery into AWIPS for the Central Region forecast offices.
Instructions Available Online http://cimss.ssec.wisc.edu/~jordang/awips-modis/
Participating Offices Current • Davenport, Iowa (DVN) • La Crosse, Wisconsin (ARX) • Milwaukee/Sullivan, Wisconsin (MKX) • Riverton, Wyoming (RIW) Future • Des Moines, Iowa (DMX) • More
AWIPS D-2D • Advanced Weather Information Processing System • Display Two-Dimensions • GUI; no command line • One-stop mechanism for gathering and viewing all operational weather data at National Weather Service field offices, including model data, satellite data, observations, lightning, local radar, etc.
AWIPS D-2D Panes
Types of Imagery and Products • 1 Kilometer Resolution • Visible (Band 1) • Snow/Ice (Band 7) • Cirrus (Band 26) • 3.7µm (Band 20) • Water Vapor (Band 27) • IR Window (Band 31) • 11µm – 3.7µm product
Sample Images 3.7µm Cirrus Snow Visible
Sample Images WV 11µm – 3.7µm IR
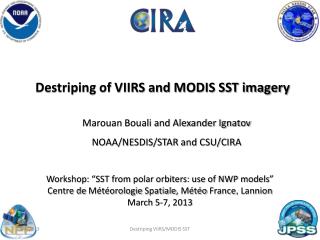
Types of Imagery and Products • 4 Kilometer Resolution • Total Precipitable Water (TPW) • Cloud Phase (CTP) • Cloud Top Temperature (CTT) • Marine (1 Kilometer) • Sea Surface Temperature (SST) Two sets: eastern and western United States
Sample Images TPW SST(Daytime) CTT
Processing Mechanism • Obtain a McIDAS (University of Wisconsin Visualization Tool) area file of image or product • Fit to a predefined region used in AWIPS (eastConus, westConus) • Zero-fill area of NetCDF where there is no subset of the MODIS pass • Compress using zlib • Apply naming convention
Processing Mechanism SSEC_AWIPS_MODIS_EAST_4KM_CPI_AQUA_YYYYMMDD_HHMM.7361
Delivery Process 96 kbps connection
Hurdles • Local Data Manager (LDM) • Compatibility between LDM5 and LDM6 • Size of queue • Local Data and Dissemination (LDAD) • Receiving machine at NWS field offices is not Linux; slow • Bandwidth • Load time • Loops
SBN/ NOAAPORT LDAD
Weaknesses • Delayed • Processing and delivery takes over an hour • Working to improve • Lack of Consistency • Forecasters have difficulty memorizing Terra and Aqua pass schedules • Similarity to other satellites • Since GOES visible imagery is available in a timely manner, there is not much benefit to using MODIS visible • Addition of POES in upcoming builds
During forecast preparation: Most Used 11µm – 3.7µm Product (Fog) Total Precipitable Water (TPW) Sea Surface Temperature (SST) Water Vapor (WV) Least Used Visible Cirrus Growing Use Snow/Ice Cloud Phase MODIS Imagery Usage
Should I add showers forthis afternoon? MODIS defines this band of clouds better than GOES.
Strengths • Creates viable connection between research environment and National Weather Service field offices • High resolution, better quality • Depiction of small-scale features • New products • Cloud Phase • Sea Surface Temperature • Upwelling
Value to Forecaster • Near-term (less than 12 hours) forecasts • Diagnosing heavy precipitation potential • Total Precipitable Water (TPW) • Determining precipitation type • Snow or freezing drizzle? • Short-term (12 to 36 hours) forecasts • Areas of fog formation • Temperatures in lakeshore areas • Post-event analysis • Temperature of significantconvective cells
Value to Forecaster • Aviation • Small-scale orographic turbulence • Climatology • Diagnosing areas of accumulated snow • Formation of ice on sizeable lakes and other waterways • Marine • Wind shift on Great Lakes • Local phenomena
Area Forecast Discussion MAIN SHORT TERM FORECAST PROBLEM IS EAST FLOW AND MARINE LAYER INFLUENCE OVER EASTERN WISCONSIN...AND DENSE FOG POTENTIAL IN THE WEST. THINK MOST OF THE DENSE FOG WOULD BE IN THE RIVER VALLEYS...WITH A TENDENCY FOR PATCHY FOG AND SOME STRATUS AGAIN IN THE EAST WITH MORE OF A GRADIENT. MODIS 1 KM IMAGERY LAST NIGHT SHOWED THE DENSE FOG IN LONE ROCK AND BOSCOBEL WAS CONFINED TO THE IMMEDIATE WISCONSIN RIVER VALLEY...IMPORTANT INFORMATION. THE LOCAL RIVER VALLEY DENSE FOG IS NOT SEEN IN THE NORMAL 2 KM GOES. (HENTZ/MKX)
Interesting Examples Courtesy of Scott Bachmeier (CIMSS/SSEC)
Future Developments • Guided by needs of the forecasters • Constrained by bandwidth • True color imagery • Fixed enhancement of 256 colors • 250 m visible imagery • Weigh operational significance against interesting aspects and size (bandwidth usage) of the product • Normalized Difference Vegetation Index (NDVI)
Conclusion • With the duties of the forecaster in mind, the MODIS in AWIPS project can be successful • “How can MODIS imagery enhance the forecasting process?” • Questions? Jordan Joel Gerth, CIMSS/SSEC, October 2006