Download
1 / 60
600 likes | 744 Views
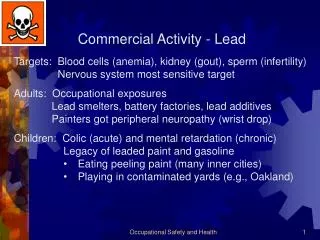
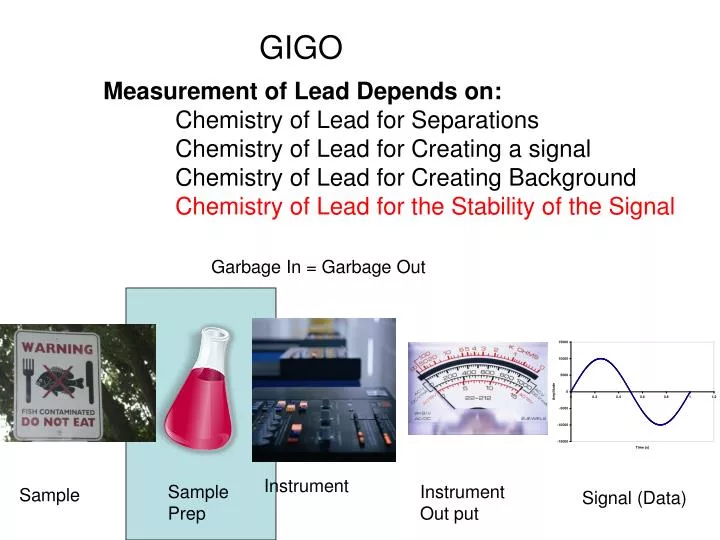
GIGO. Measurement of Lead Depends on: Chemistry of Lead for Separations Chemistry of Lead for Creating a signal Chemistry of Lead for Creating Background Chemistry of Lead for the Stability of the Signal. Garbage In = Garbage Out. Instrument. Sample Prep. Instrument Out put.

E N D
GIGO Measurement of Lead Depends on: Chemistry of Lead for Separations Chemistry of Lead for Creating a signal Chemistry of Lead for Creating Background Chemistry of Lead for the Stability of the Signal Garbage In = Garbage Out Instrument Sample Prep Instrument Out put Sample Signal (Data)
Recall we mentioned that lead resides at surface of soils because of it’s insolubility
Recall from Quant Mass balance
Mass balance Make a definition to simplify the expression, and factor out terms
1. Calculate beta values This number should be 6.4 2. Set up a column for the pH value 3. Calculate [OH-] =10^(-(14-A3)) 4. Calculate D =1 + $J$5*B3+$K$5*(B3^2)+$L$5*(B3^3)+$M$5*(B3^4) 5. Calculate alpha 0 =1/C3 6. Calculate alpha 1 =$J$5*B3*D3 7. Calculate alpha 2 =$K$5*B3^2*D3 8. Calculate alpha 3 and 4 in a similar fashion
Note that at pH < 6 all of the lead is present as Pb2+ This graph indicates that if our instrument is measuring Pb2+ then when we Prepare the sample we need to have a pH of less than 6
GIGO Measurement of Lead Depends on: Chemistry of Lead for Separations Chemistry of Lead for Creating a signal Chemistry of Lead for Creating Background Chemistry of Lead for the Stability of the Signal Garbage In = Garbage Out
Measurements based on PbS 1820 Frederick Acum London
“1 part of acetate of lead May be detected by means of it in 20000 Parts of water.”
1820 Sulphuretted water cupellation ppm LOD ppb ppt 8000 1000 1900 1990 2000 B.C.E. C.E.
More PbS measurements -log Ksp Ag2S=49
Suppose we are using a lead ion selective electrode to measure Pb2+, can We use any pH less than 6? Soln Pb -log Ksp PbS=29 Pb2+ Pb2+ S2- Ag+ Pb2+ S2- S2- controls S2- S2- S2- Pb2+ Ag+ Which controls Pb2+ S2- Ag+ Which controls -log Ksp Ag2S=49 Internal solution fixed in Ag+ Charge separation after motion of Ag+ leads to a potential across the Membrane = signal
GIGO Measurement of Lead Depends on: Chemistry of Lead for Separations Chemistry of Lead for Creating a signal Chemistry of Lead for Creating Background Chemistry of Lead for the Stability of the Signal Garbage In = Garbage Out
Other Alpha Plots are also useful If we want to separate lead on an anion exchange column form the PbCl3- species. Which line would that be? And what conc. Cl would we want?
GIGO Measurement of Lead Depends on: Chemistry of Lead for Separations Chemistry of Lead for Creating a signal Chemistry of Lead for Creating Background Chemistry of Lead for the Stability of the Signal Garbage In = Garbage Out
Lead Chloride, while useful for an anion exchange separation is a problem Because of it’s low vapor pressure Water is shown for comparison. What this means is if you get about 700 oC You will have a large vapor pressure for PbCl2 which means you lose Stuff from solution
GIGO Measurement of Lead Depends on: Chemistry of Lead for Separations Chemistry of preparing the sample Chemistry of Lead for Creating a signal Chemistry of Lead for Creating Background Chemistry of Lead for the Stability of the Signal Garbage In = Garbage Out only instrument you have is a….. UV-Vis Spectrophotometer UV-Vis monitors valence shell electrons Need to convert Pb to something that a. Has UV-Vis activity b. That can be selective toward Pb binding c. That can be separated from other binding metals
Not water soluble Loss of a proton makes this a good Complexing agent if mixed with Aqueous Pb2+ What problems can we run into? • pH not high enough to remove proton • pH too high and results in lead hydroxide formation
Need to consider this a separation D Higher pH To get reproducible results you will need to Set a standard procedure for number of Shakes and total time.
Also not water soluble Non-Water soluble
Other Considerations? False Positives Any other metals (including Mg2+!!!) can cause a color change The chalk used to line the interior of your Protective gloves can cause false positives Solution? Selectively complex other metals and leave behind the lead!!!!
Which complexing agent would you use? CN might be good BUT!!!!! Want low value for lead High value for others
Iron ferricyanide Serves as an Oxidizing/reducting reagent Add CN to get rid Of Cd, Hg, Ni, Ag, and Zn, But Also add Citrate to pull The iron from ferricyanide To citrate form.
Mild oxidation of the un-reacted Dithizone results in a dimer linked by a S-S bond which absorbs at 420 (see spectra 2). More extended oxidation results in cyclization with a product that absorbs at ~610 to 620 nm. Estimated molar absorptivity of the dimer is 30000 to 49000
Some “Data Considerations” How will you choose a wavelength from which to make a calibration curve? How will you determine if you still have unreacted dithizone contributing to Your signal? How will you quantitate the absorbance at the wavelength you choose?
How will you choose a wavelength from which to make a calibration curve? • Want a region where the signal does not change rapidly (the top of a peak) • Want a region where the analyte signal has the least contribution from the background (peak of Pb-complex) How will you determine if you still have unreacted dithizone contributing to Your signal? 1. Monitor wavelength of peak in the 600 region or deconvolute the data How will you quantitate the absorbance at the wavelength you choose?
Method 1 Monitor B at wavelength where only B absorbs and at the wavelength of interest Make a calibration curve at those wavelengths with standards for The background (unreacted dithizone); determine molar absorptivities Calculate concentration of unreacted dithizone for the measurement of Pb by Use of the calibration curve for unreacted dithizone Calculate the absorbance due to unreacted dithizone
Measurement Method 2 Much easier And makes no Assumptions about What is contributing To the background Background A Set a baseline across the bottom of the peak The difference in absorbance between the two is the background corrected signal Baseline estimation Use this lab to introduce another data manipulation
Use this lab to introduce another data manipulation Method 3 – assess contribution by assuming Gaussians
Assume absorbance peak is Gaussian in the energy spread Energy of The absorption bands photons e Energy levels are randomly populated By Temperature Frequency = absorption Std~(first guess) width at ½ peak ht Energy of light absorbed
Deconvolution 1. Get the absorption spectra
Deconvolution 1.Assume absorbance peak is Gaussian in the energy spread 2.Convert data from A vs wavelength to A vs energy Notice the 2 curves look Different!
Deconvolution 3.Using your data estimate: center of peak (mean) standard deviation amplitude A std mean
Wavelength, nm Frequency, Cm-1
Sum of all the bands Guess four absorbance bands Conversion to energy Value to be minimzed =10000/A10 =(H10-B10)^2 Calculated bands based on a Gaussian eq
energy wavelength Minimize Target cell Prevent solver from giving You non-plausible (negative) numbers
Plot the wavelength based absorption data And superimpose the data generated by solver
Now sum all the individual bands and see if you get a low sum of sq differences Some deviation here But generally pretty darn good
At the wavelength you are interested in Go to the column of data representing that Single absorbance band here I use 550 and find the max =max(data range) This will be your absorbance of the band Without the contribution from the other bands Our “signal” Go to 550 and use the A from this band Only!!! (all other absorbances represent Background contributions)
Chemistry titrimetric ppm cuppellation LOD ppb Suphuretted water dithizone ppt 8000 1000 1900 1990 2000 B.C.E. C.E. This method resulted in the first public health Awareness of lead as an issue for children Baltimore, Department of Public Health
GIGO Measurement of Lead Depends on: Chemistry of Lead for Separations Chemistry of Lead for Creating a signal Chemistry of Lead for Creating Background Chemistry of Lead for the Stability of the Signal Garbage In = Garbage Out Convert lead to some compound which can Be measured by some instrument (what ever happens to Be available in your lab) Suppose you only have a fluorimeter!
Calcein Blue Chromophore – part of molecule sensitive to light “Selectivity” arm – complexes the metal ion and turns On and off fluorescence
320 nm excitation Excited State Proton transfer Note role of resonance here Emission Spectra, excitation at 320 Absorbance spectra 480-490 nm emission 18-33 ns duration pH 6-8 Carboxyl groups only deprotonated
Excited State Electron transfer 350-360 440-460 H-N pH 8-11 Ground state phenolic deprotonation