Download
1 / 8
80 likes | 222 Views
WEATHER. TOPIC 7. STATION MODELS. What are weather predictions based upon?. Weather Predictions are based upon probability (the chance of occurrence) and looking at weather relationships using computer models. What are some of the simple relationships in weather (review)?.

E N D
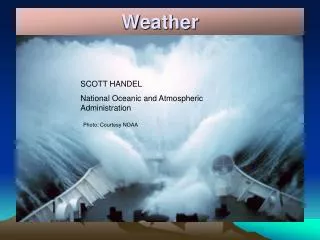
WEATHER TOPIC 7 STATION MODELS
What are weather predictions based upon? Weather Predictions are based upon probability (the chance of occurrence) and looking at weather relationships using computer models.
What are some of the simple relationships in weather (review)? • Temperature and Pressure – As temperature increases, pressure decreases. • Chance of Precipitation increases as air temperature and dew point temperature get closer together—because the relative humidity increases. • The greater the air pressure gradient, the faster the wind speeds and closer the isobars • Rapidly falling air pressure at a location indicates a low pressure center is approaching and stormy weather is approaching
What is a station model? A station model is a circle with symbols indicating a locations weather. These symbols include those for temperature, pressure, wind direction, wind speed, precipitation, dew point temperature and cloud cover. ESRT pg. 13
On a station model, how is pressure represented? How can it be rewritten? • The pressure is located in the upper right hand corner on the station model. It contains 3 numbers. The leading number 9 or 10 is omitted as well as the decimal place. In order to convert the pressure number on the station model to an actual pressure in millibars use the following rules: • If the number is above 500, place a 9 in the front and add a decimal before the last number • If the number is below 500, place a 10 in front and add a decimal before the last number • EX: 531 953.1 mb 217 1021.7 mb 039 1003.9 mb 764 976.4 mb
How is wind speed and wind direction shown on a station model? • Wind speed and wind direction are shown on the station model as a line extending out from the circle. This line shows the direction in which the wind is coming from. On this line are “feathers”, which tell you wind speed. A long feather indicates 10 knots and a half feather indicates 5 knots. • On this station model the wind direction is NE and the wind speed is 20 knots.
Where are the dew point and air temperature values located on a station model? • Dew point and air temperature values are shown on the left side of the model. The air temperature is in the upper left hand corner and the dew point temperature is in the lower left hand corner. • Both temperatures are measured in Fahrenheit. • Temperature = 76° F Dew Point = 55° F
How does a station model show cloud cover? • The shading of the circle shows cloud cover. The more shading there is, the cloudier it is. • Ex: CLOUDY SCATTERED BROKEN CLEAR PARTLY CLOUDY